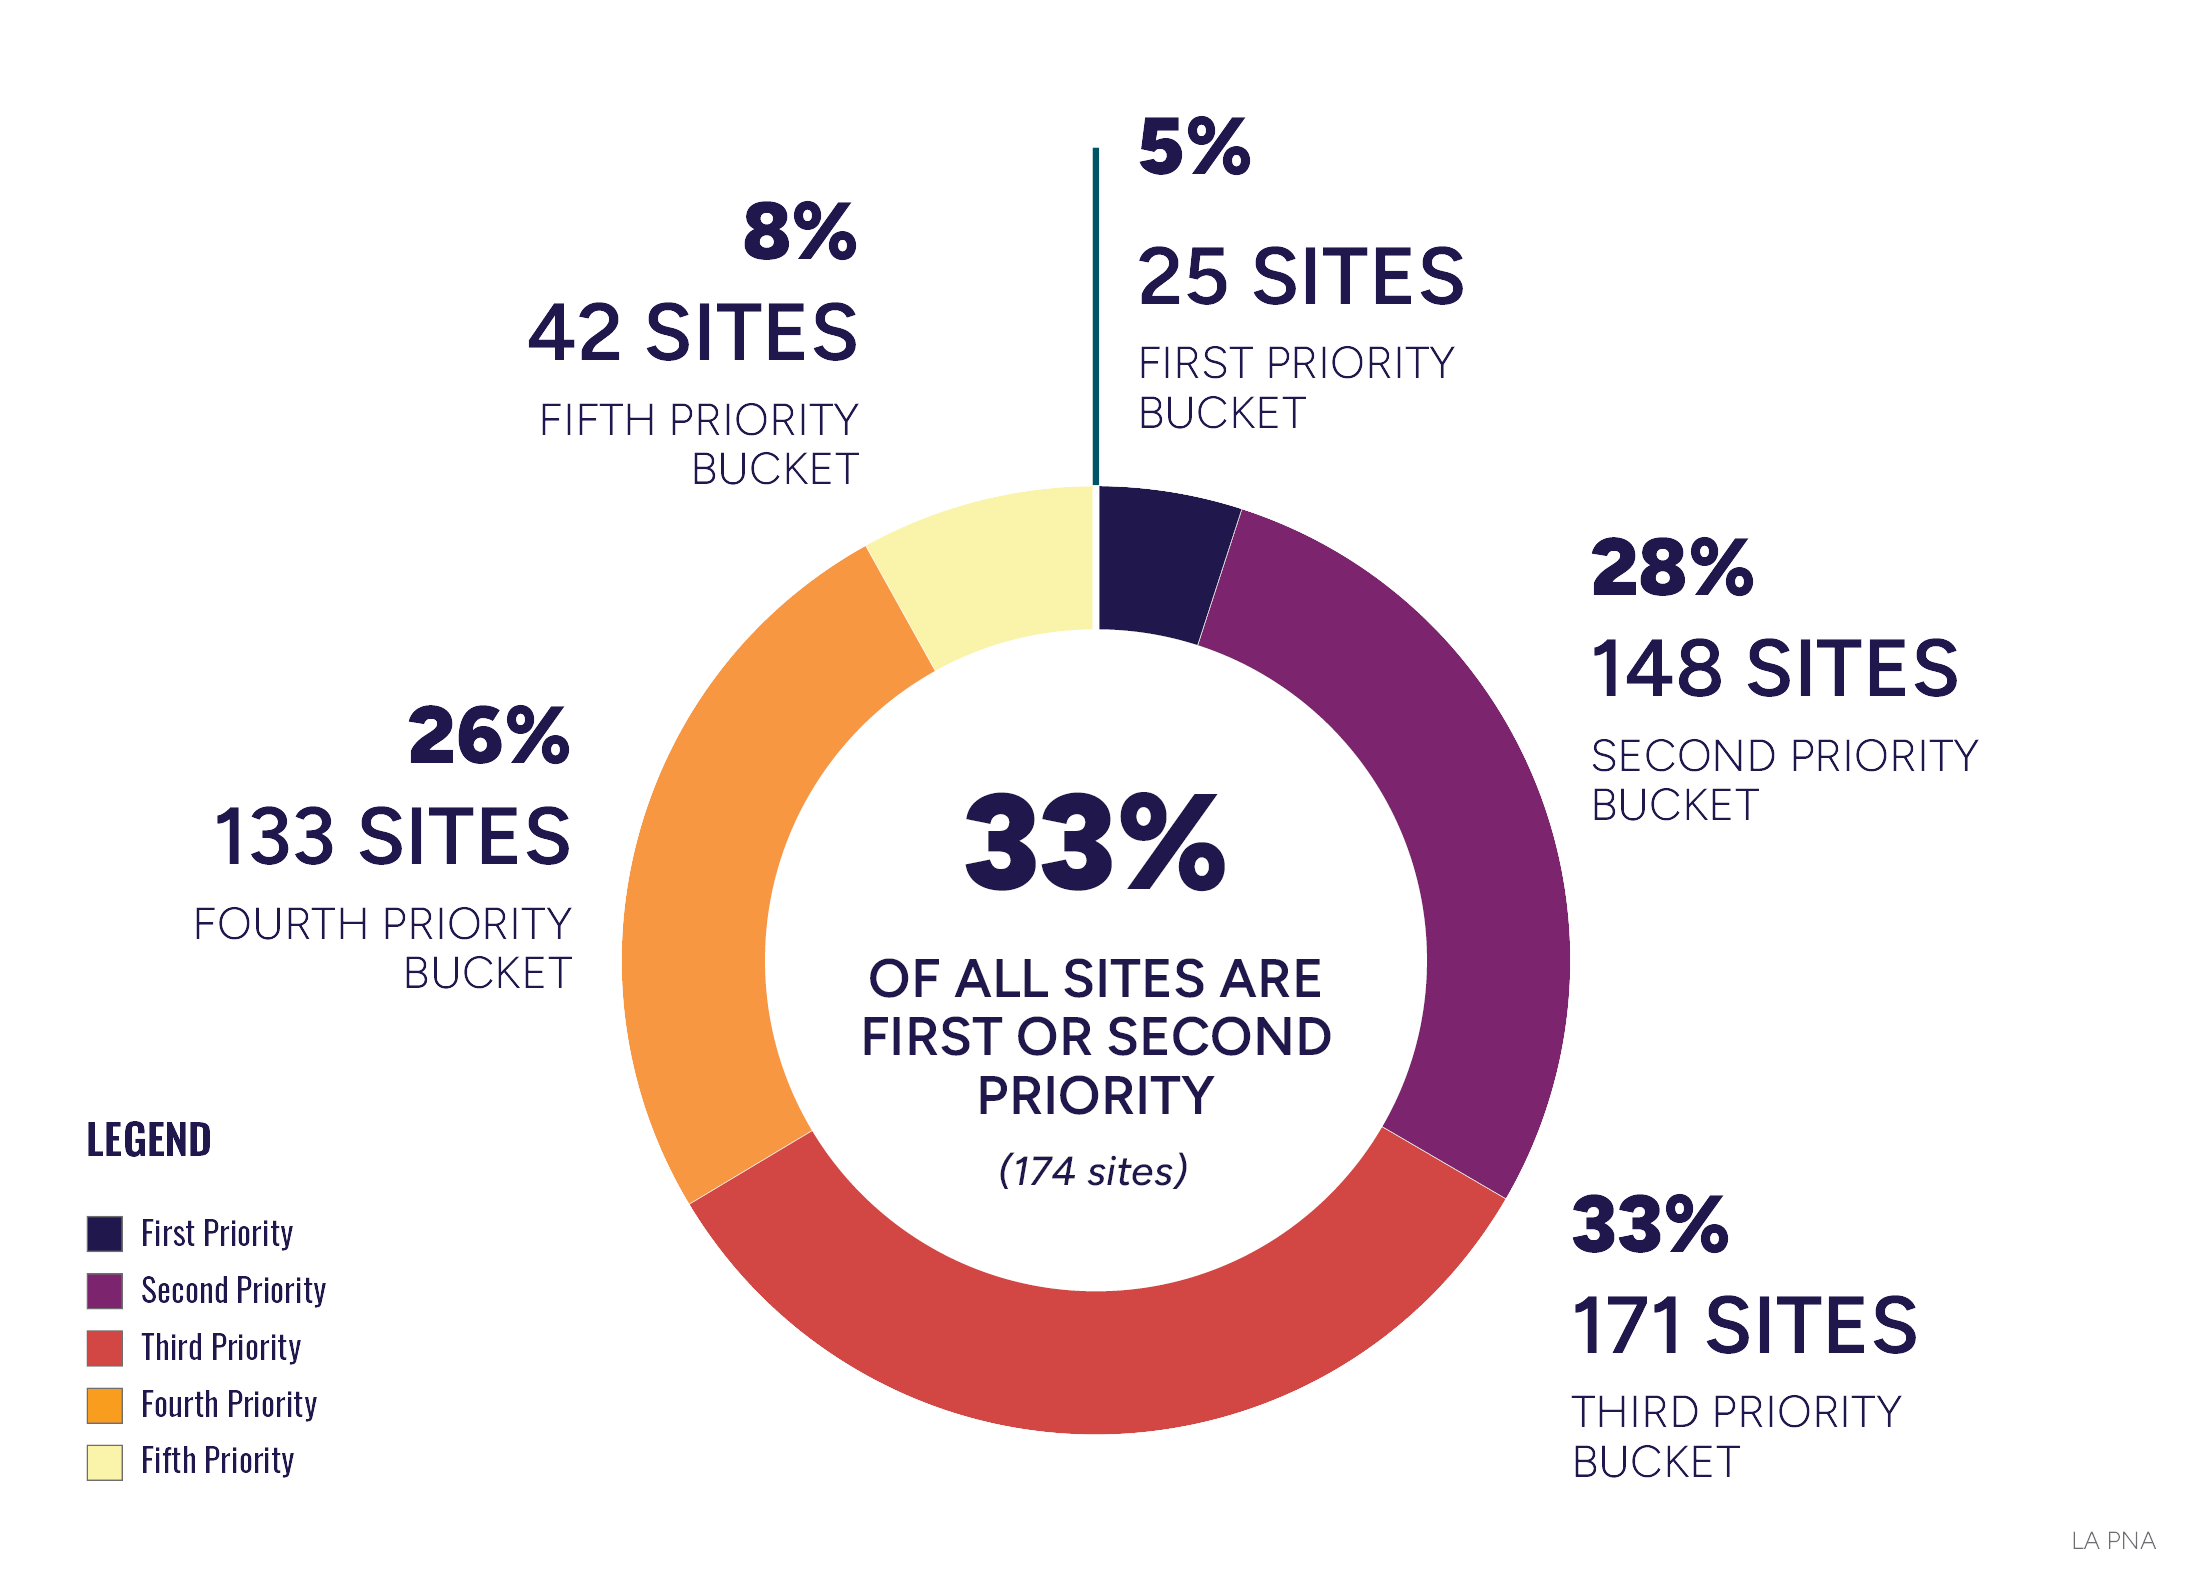
Overall Results
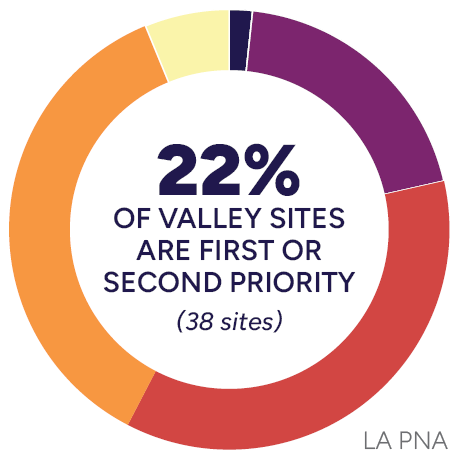
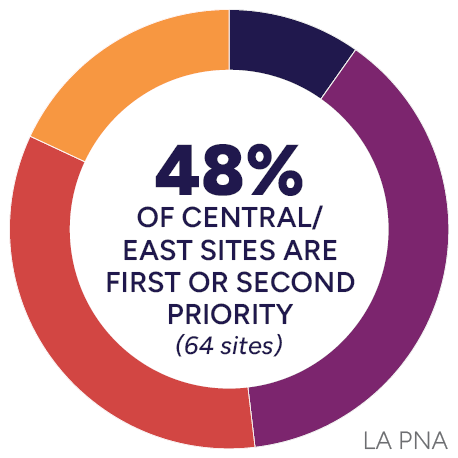
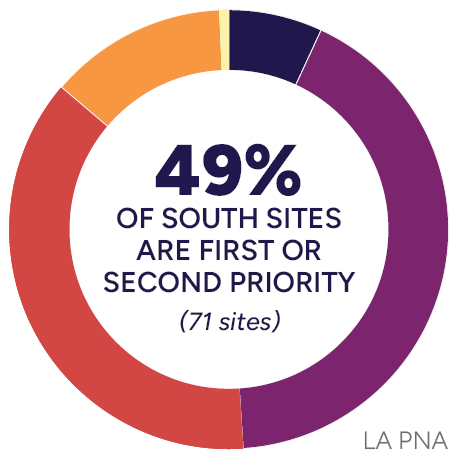
Of the 519 sites, 174 (33%) are first or second priority–including 38 (22%) of the Valley sites, 64 (48%) of the East/Central sites, 71 (49%) of the South sites, and 1 (2%) site in West LA. A full list of sites with their priority ranking can be found in the table below.
Parks and prospective park sites were prioritized based on a system of community and data driven criteria
Results by Region and Classification
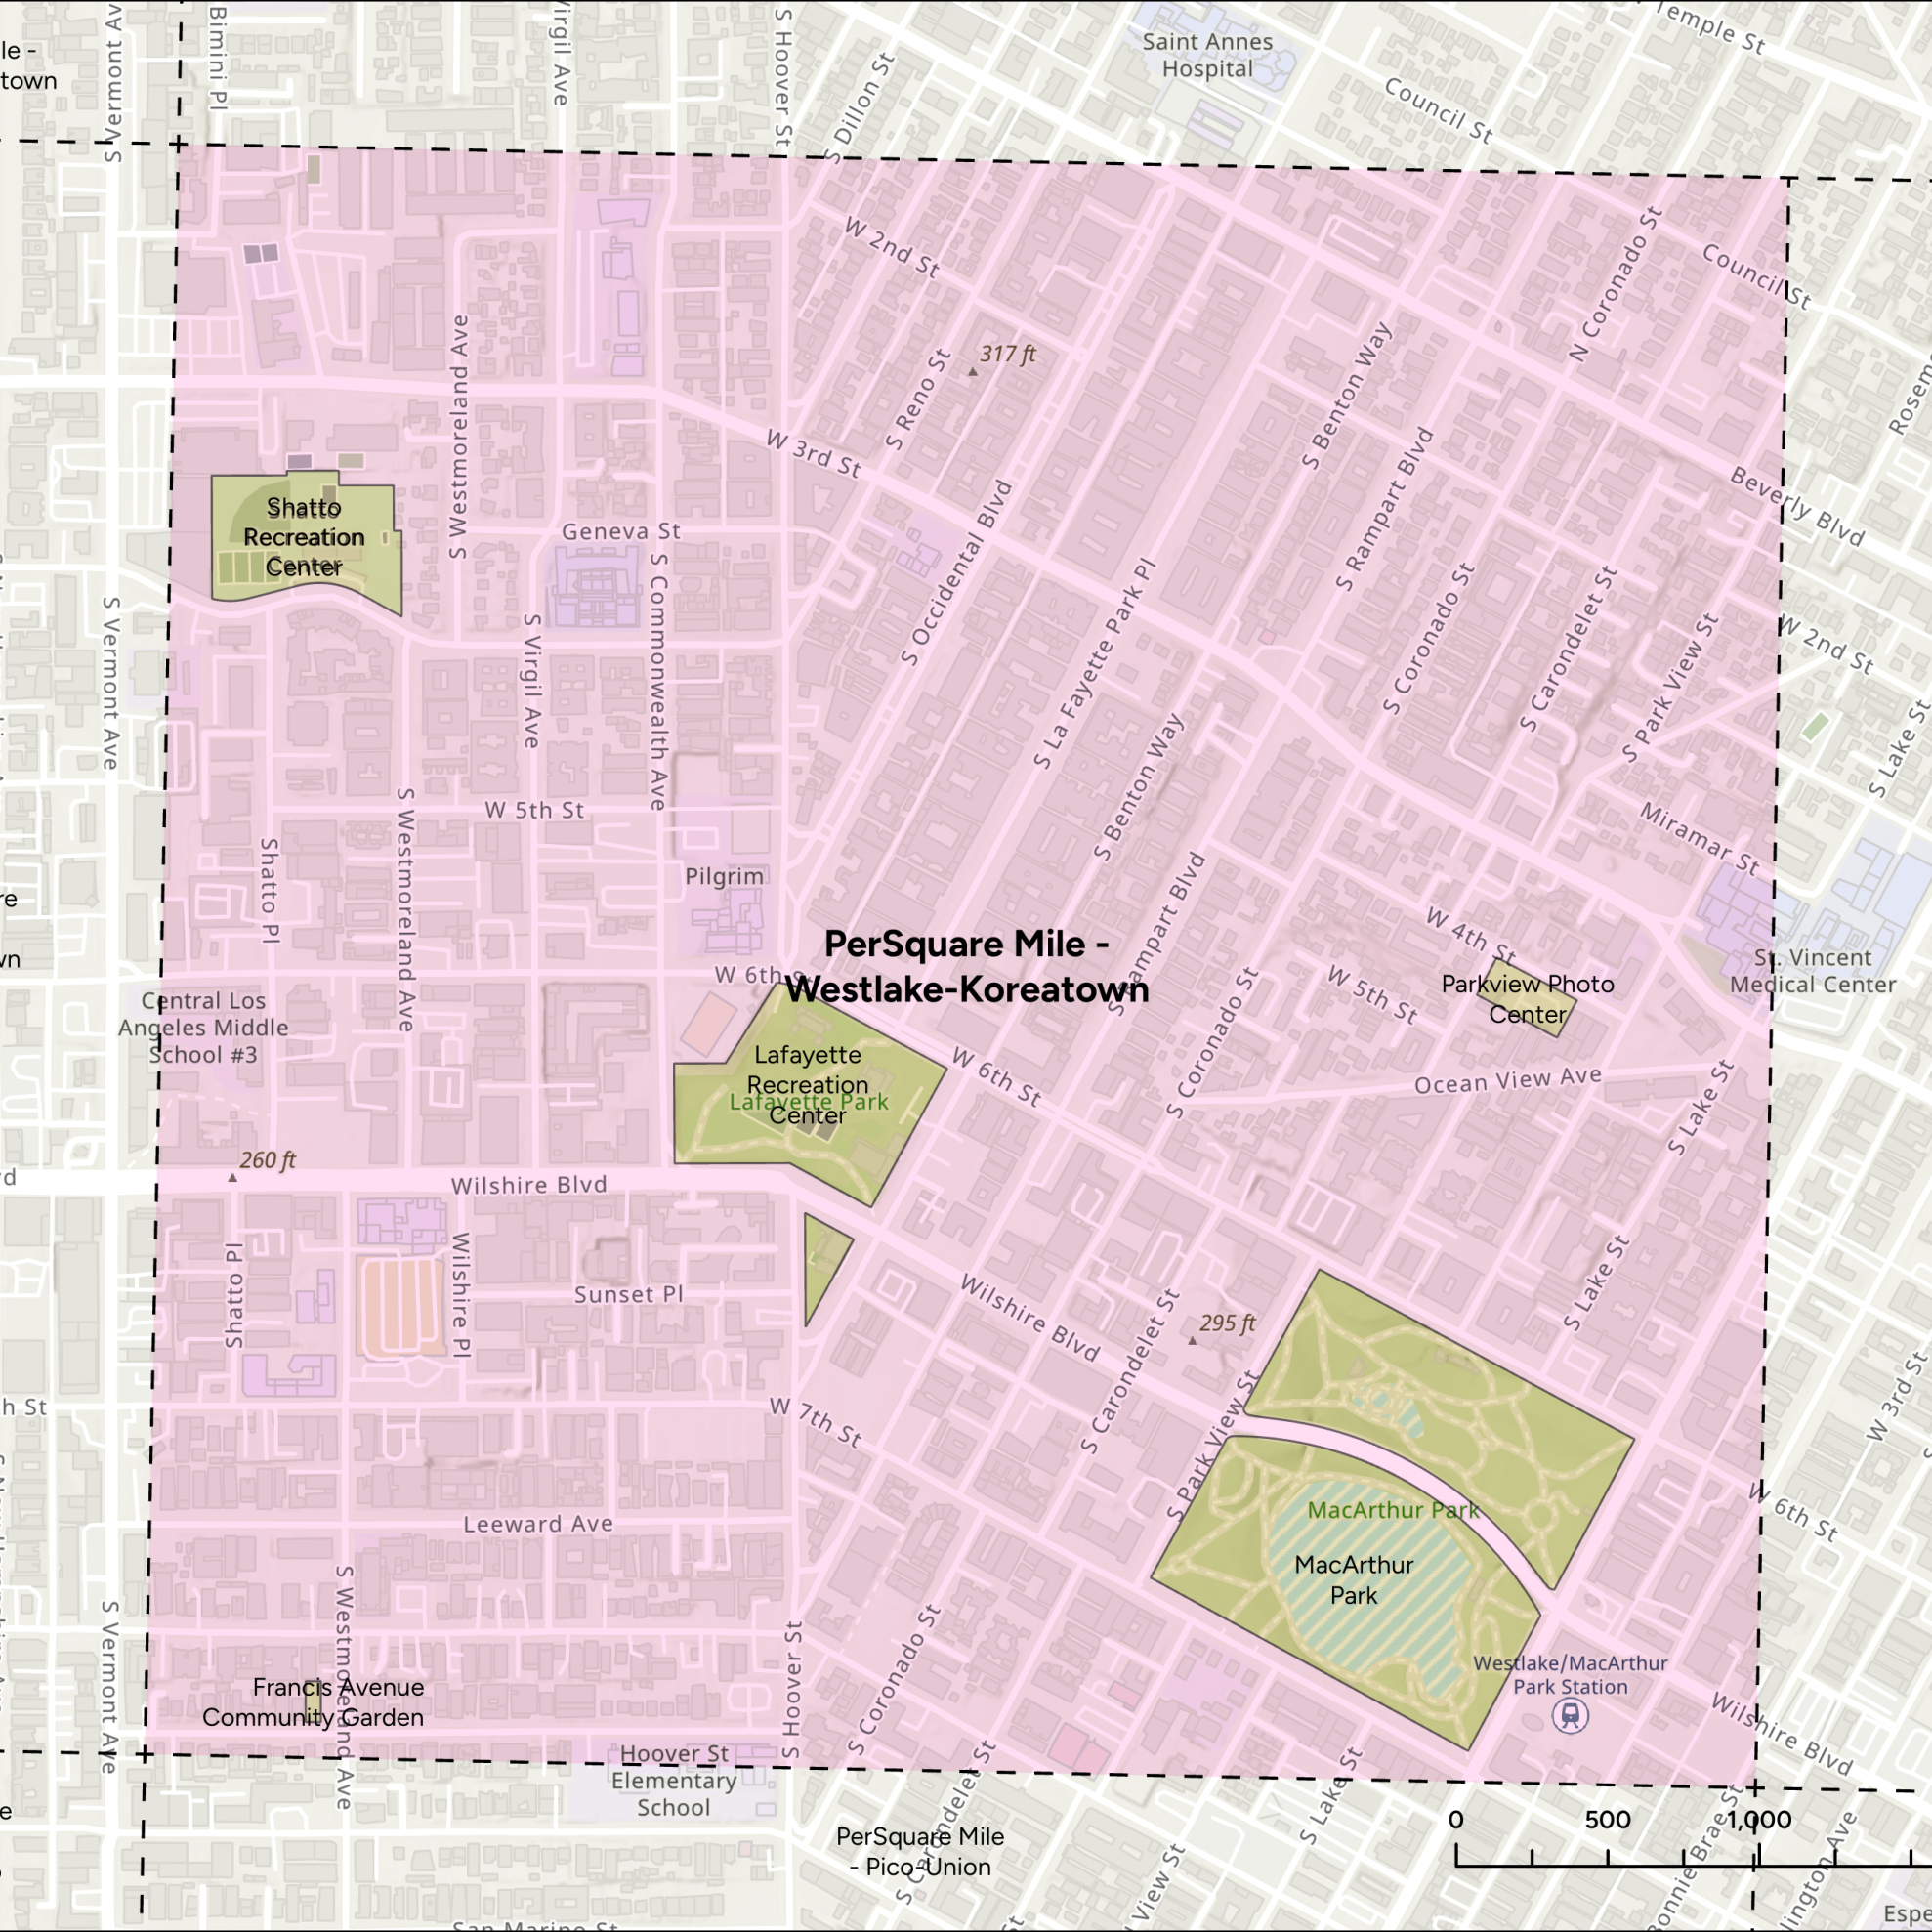
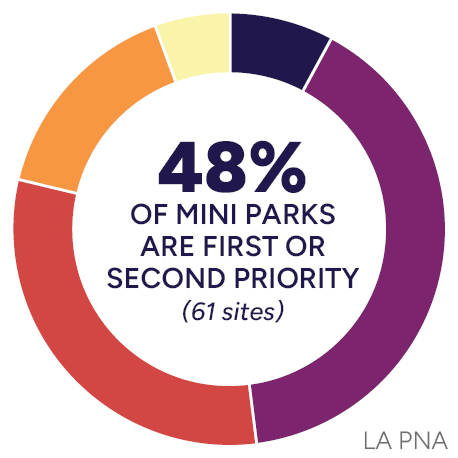
Looking across the City of LA, sites of highest priority sites are clustered in East, Central, and South LA as well as portions of the southern and eastern San Fernando Valley. Looking at the sites by classification, mini parks and prospective sites made up the majority of first and second priority sites. Many second priority sites were neighborhood parks.
Prioritization by Region
Valley
Top 5 Sites
East/Central
Top 5 Sites
South
Top 5 Sites
West
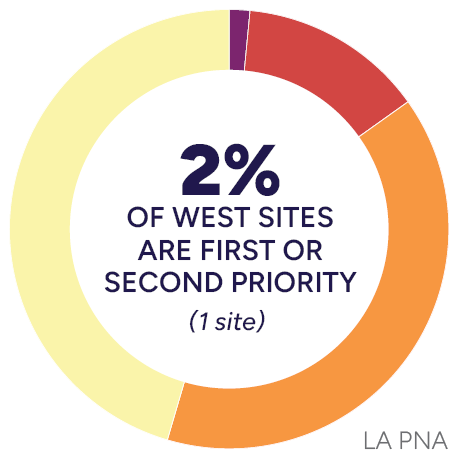
Top 5 Sites
Prioritization by Classification
Mini Park
Top 5 Sites
Prospective Site
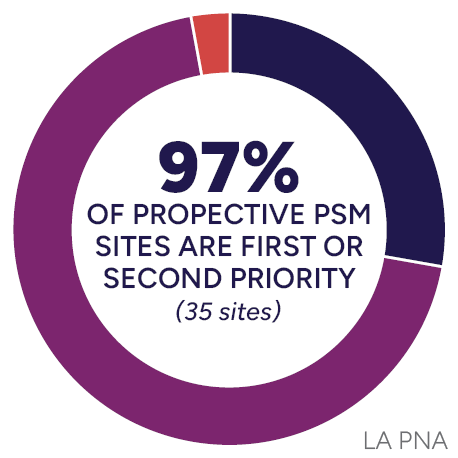
Top 5 Sites
Community Park
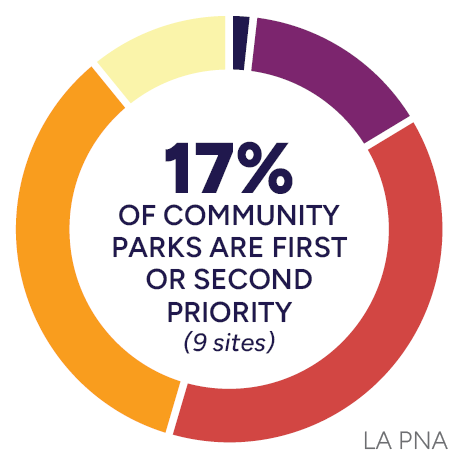
Top 5 Sites
Neighborhood Park
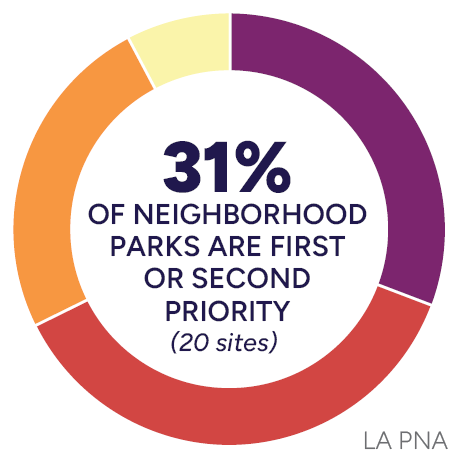
Top 5 Sites
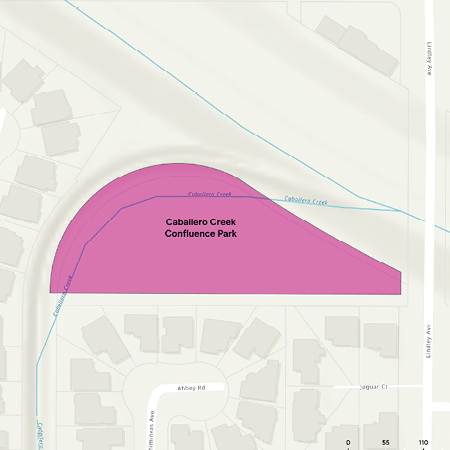
Site Prioritization Rankings
The rankings show high priority sites clustered in East, Central, and South LA as well as the southern and eastern San Fernando Valley.
First Priority Sites
These sites represent those that scored the highest out of all 519 in the prioritization framework. They range in classification, size, and region.