To prioritize where RAP should invest first, a system of criteria was used to assess existing parks and areas for potential future parks. These criteria are based on community, agency, and stakeholder feedback as well as recreation and parks best practices. These criteria are indicators of need for park investment across the City and cover park and recreation topics like park pressure and amenity conditions but also social and environmental equity, resilience, and alignment with other City and County initiatives.
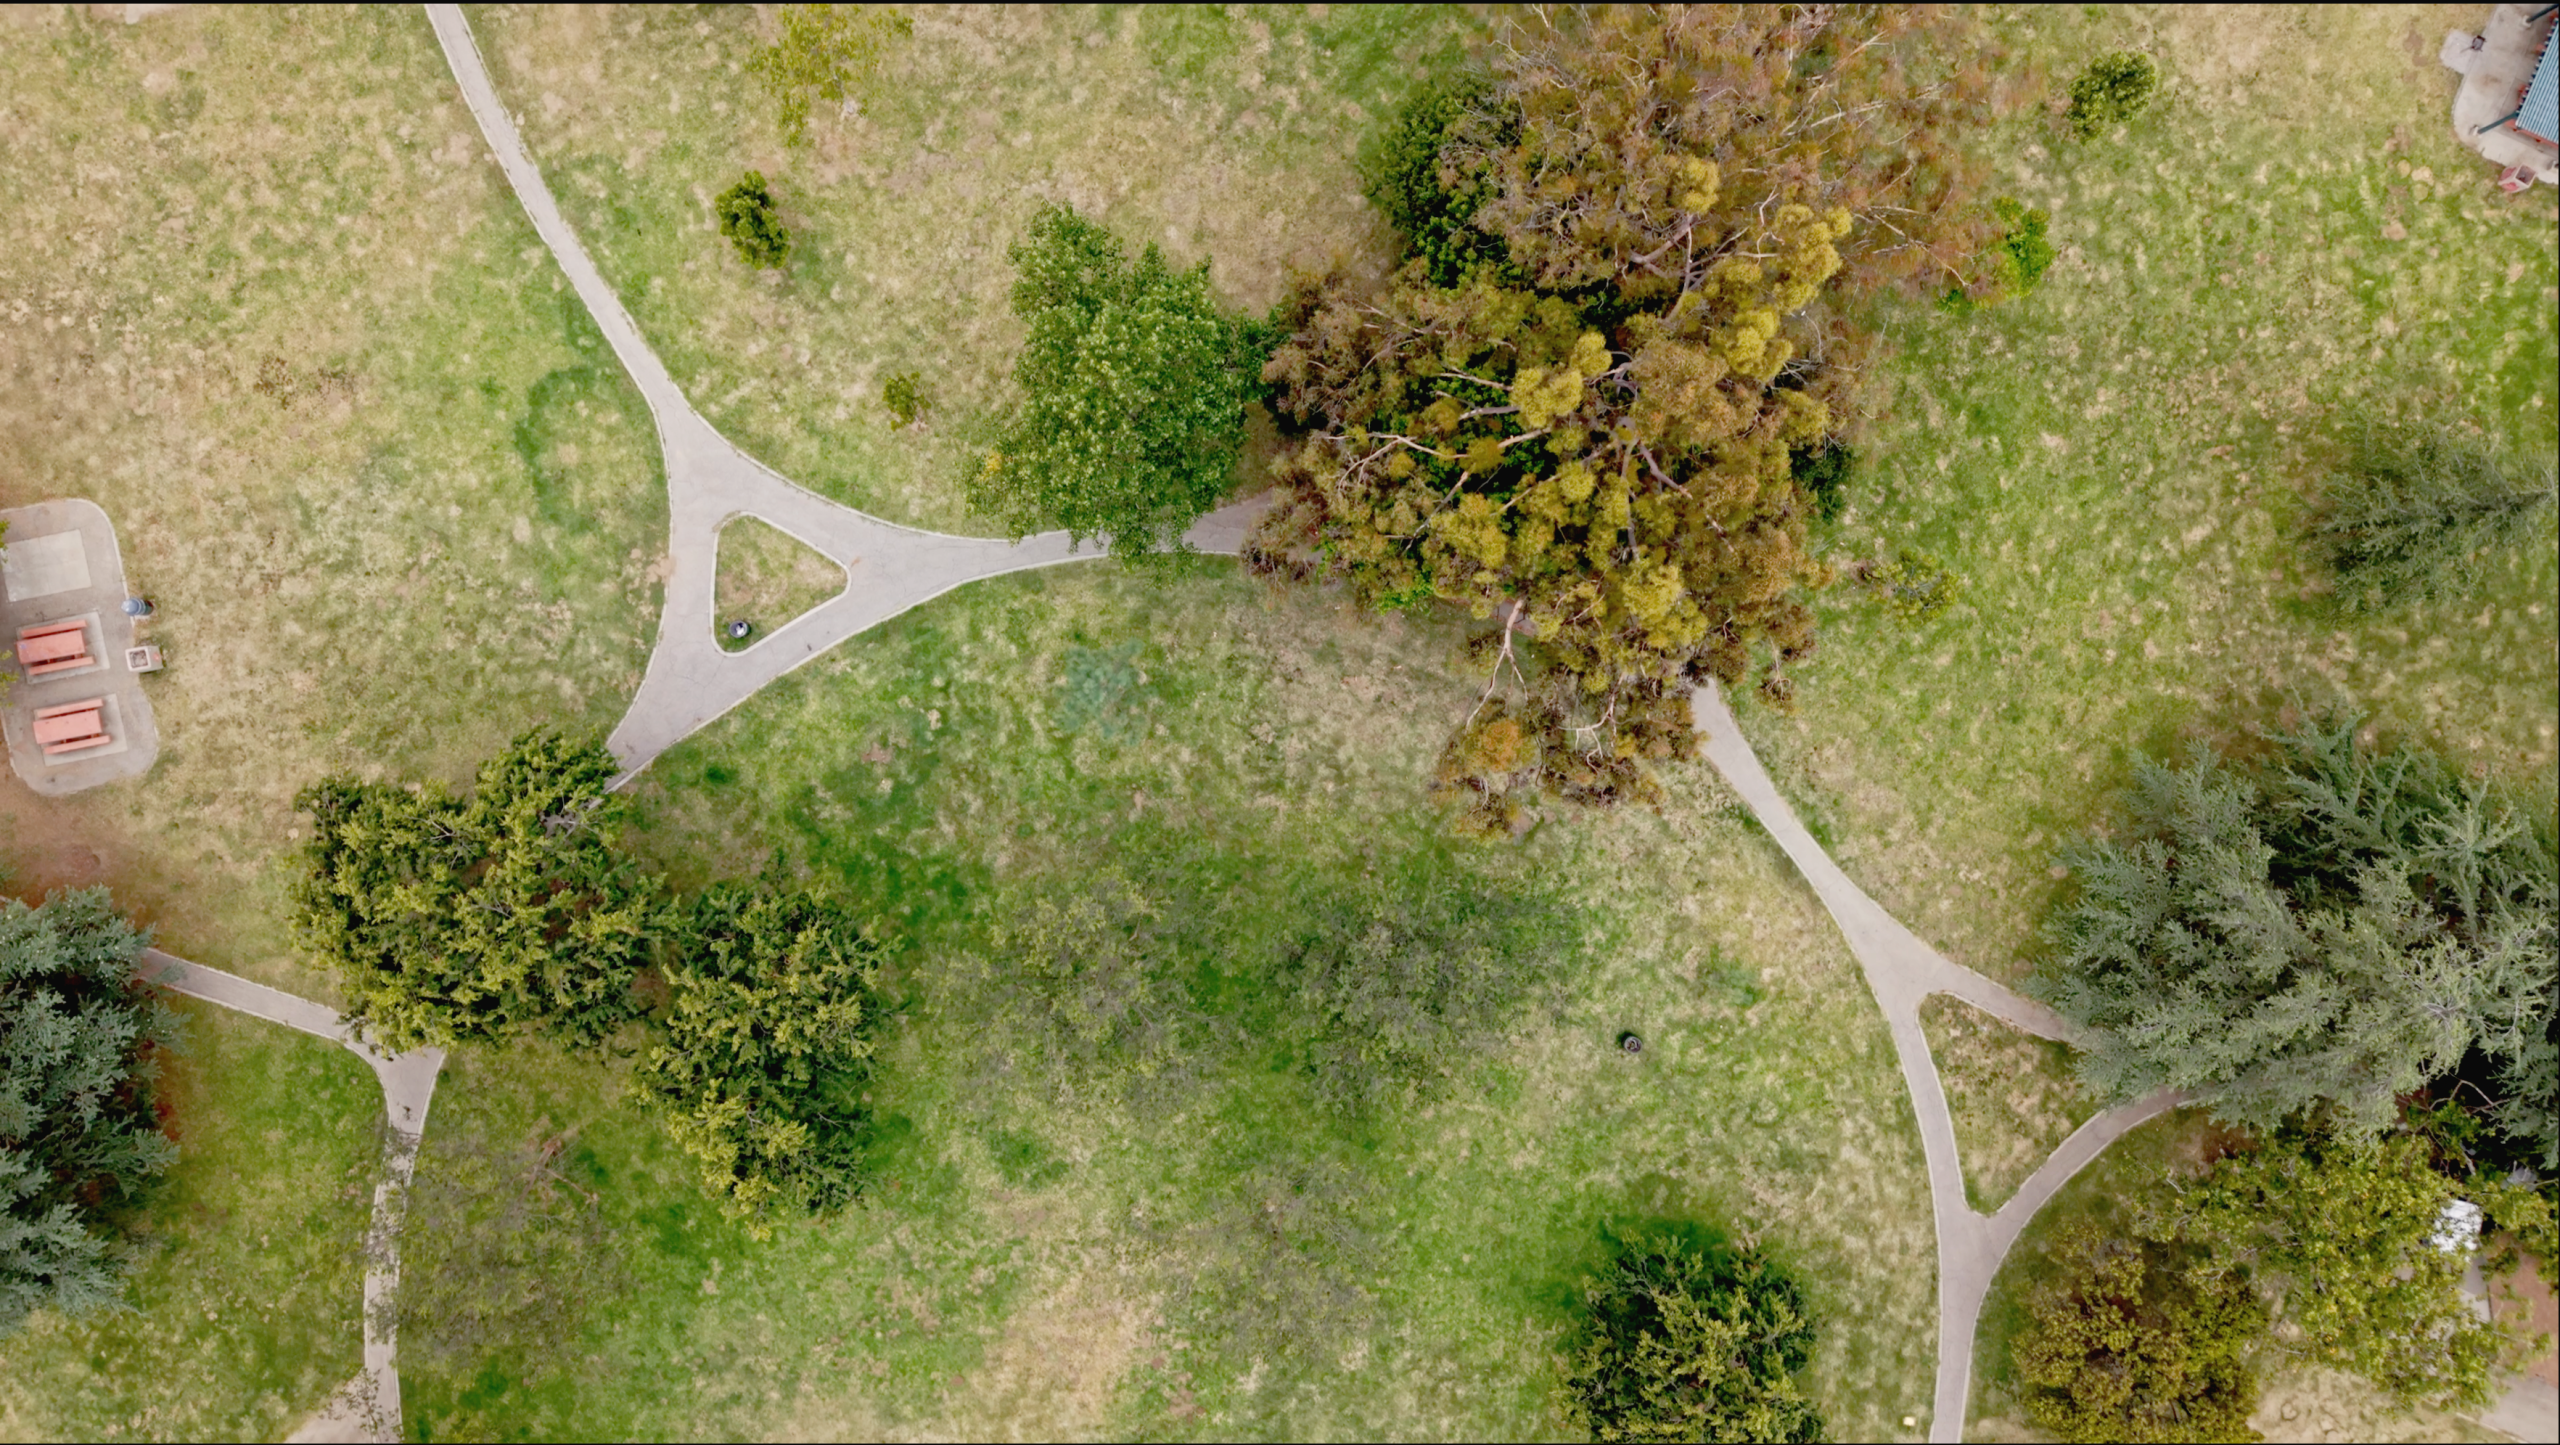
A circular path connects different parts of Ernest E. Debs Regional Park.
Universe of Sites
Both existing park sites and priority areas for new parks were evaluated in the PNA site prioritization.
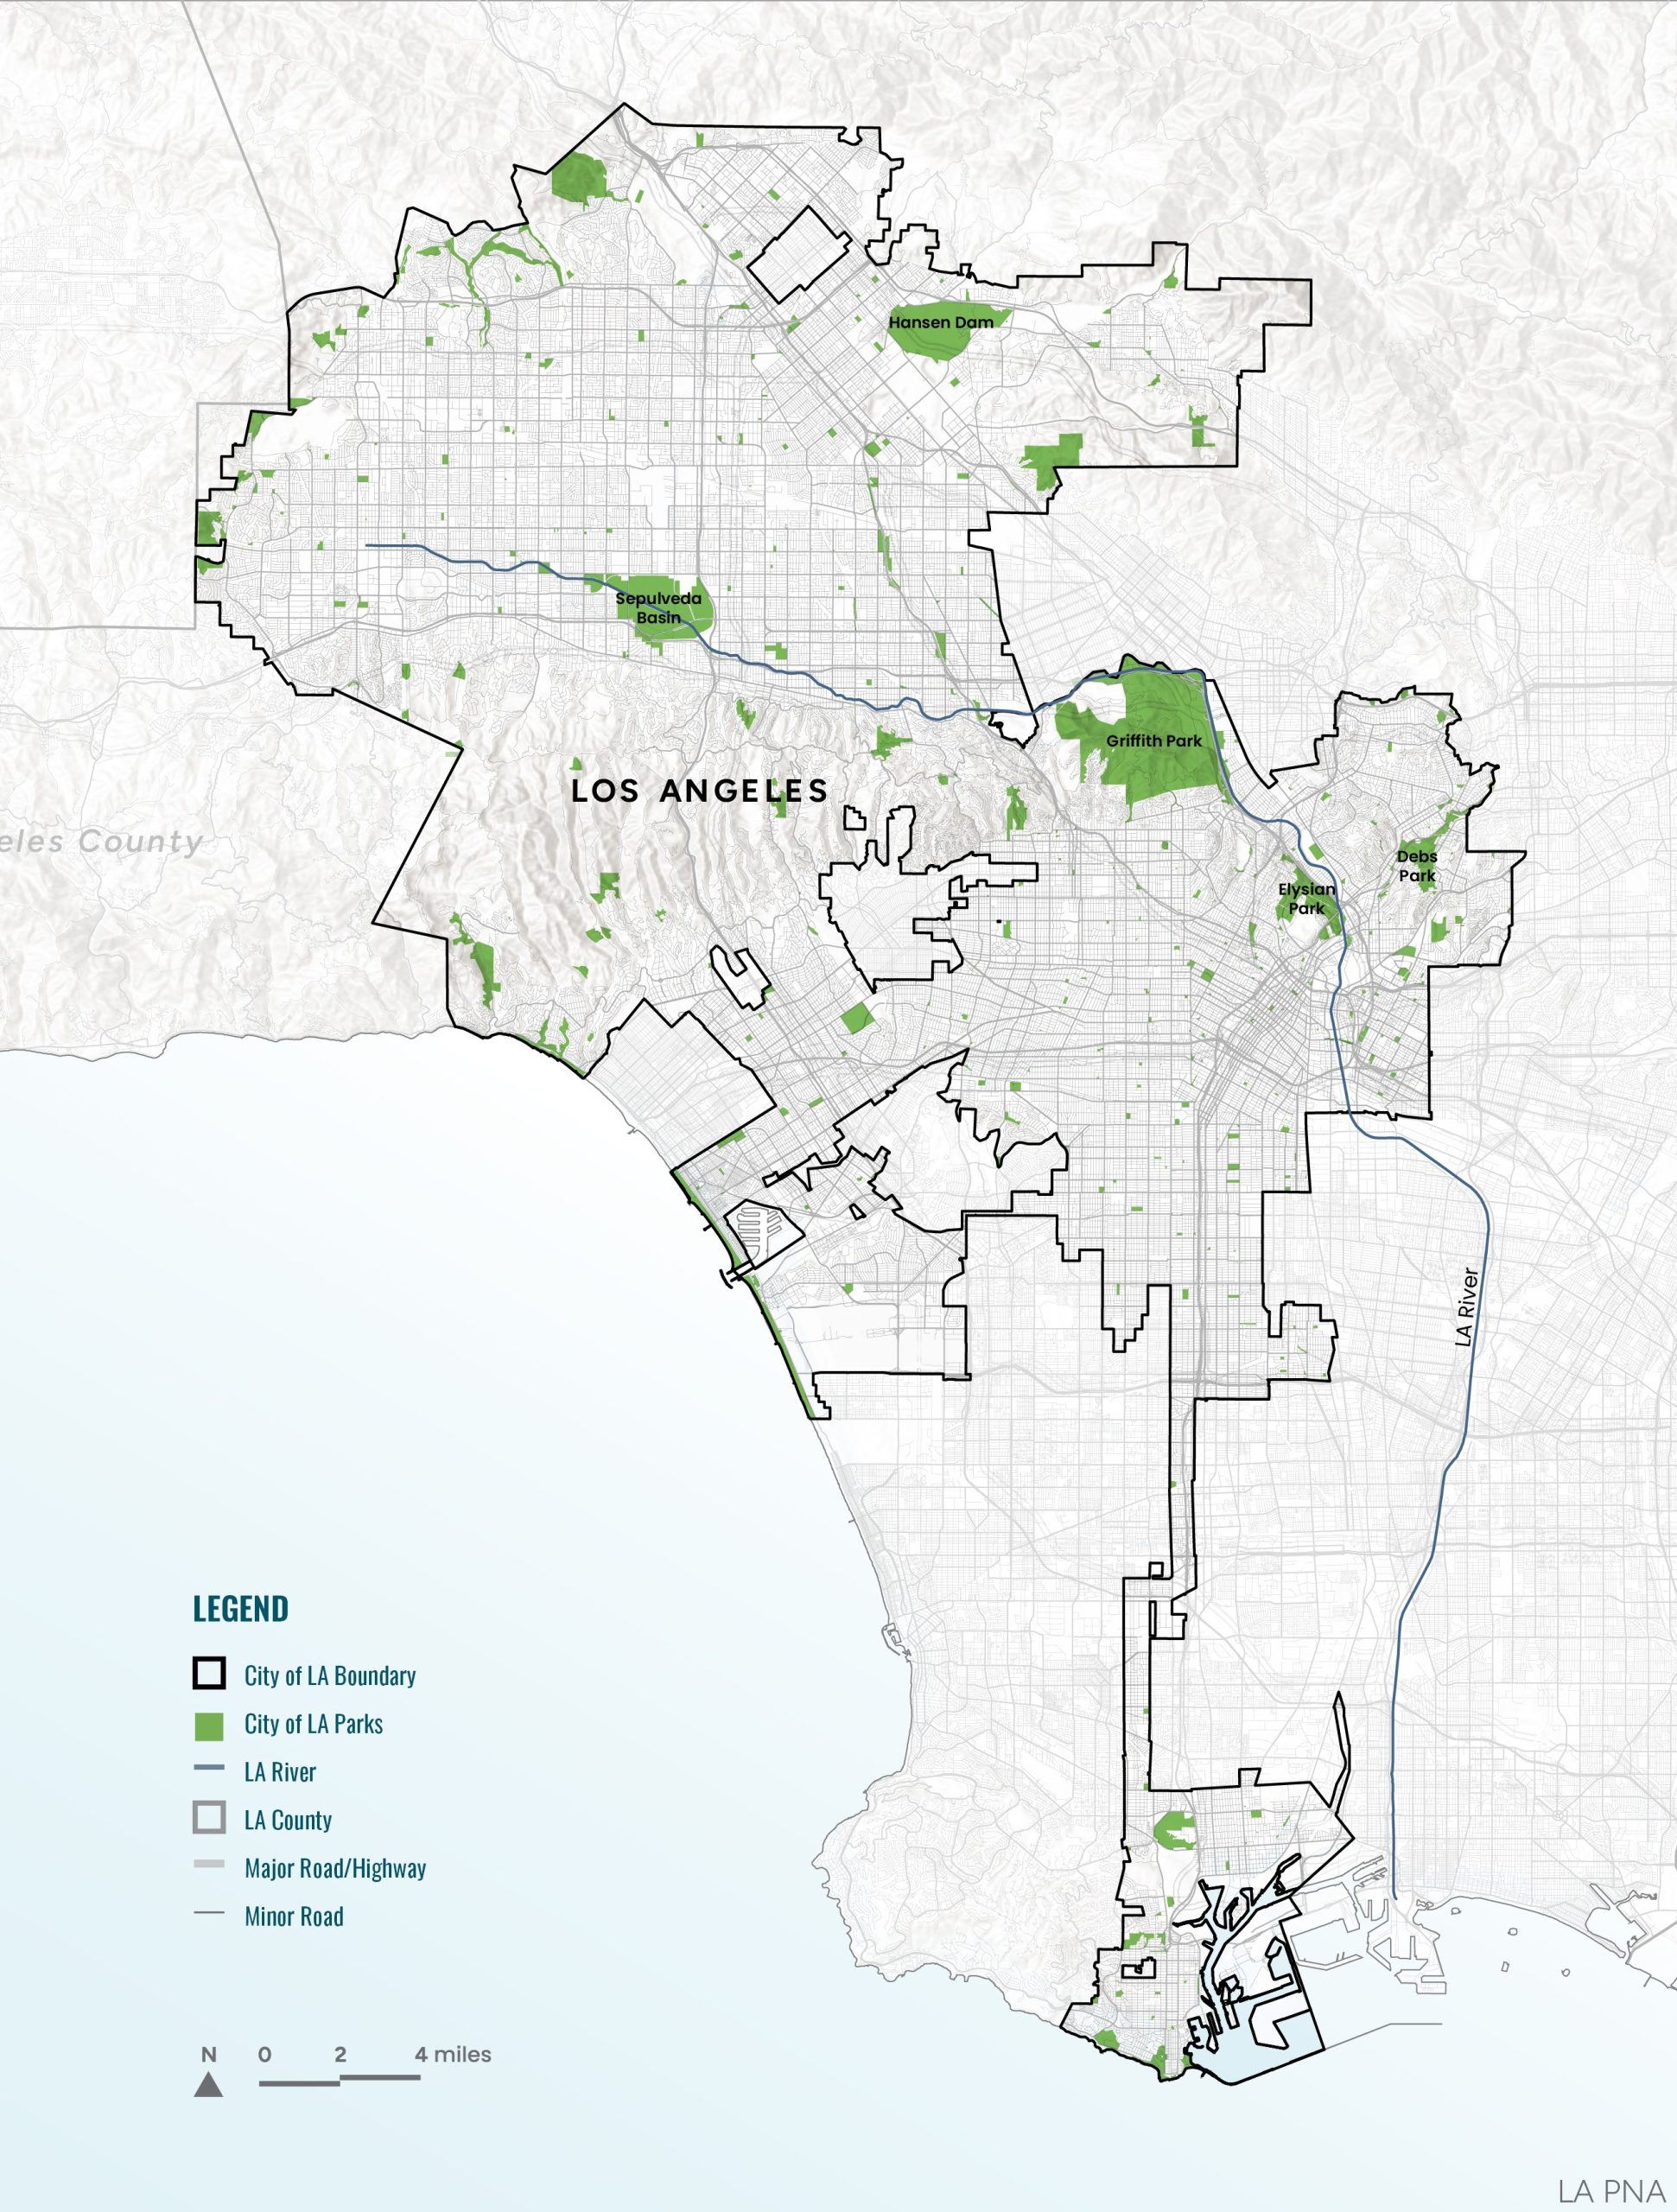
The context and challenges of the parks and facilities in the RAP system vary greatly across the City. Prioritizing future investments first requires having an up-to-date inventory of all the sites that RAP could potentially invest in–referred to within the PNA as the “Universe of Sites.” The Universe of Sites includes RAP’s existing parks as well as new park priority areas where RAP might invest in developing new parks so that both can be scored and prioritized side-by-side within the same system.
Existing RAP Park Sites
RAP manages over 500 parks and sub parks within its system. For the purposes of the PNA site prioritization for future investment, camps outside of City boundaries (e.g., Camp Valcrest and Camp High Sierra) were excluded. Additionally, subparks (e.g., the Los Angeles Zoo and Botanic Gardens within Griffith Park) were not considered independently. With those exceptions and exclusions, 483 existing park sites were evaluated as a part of the Universe of Sites.
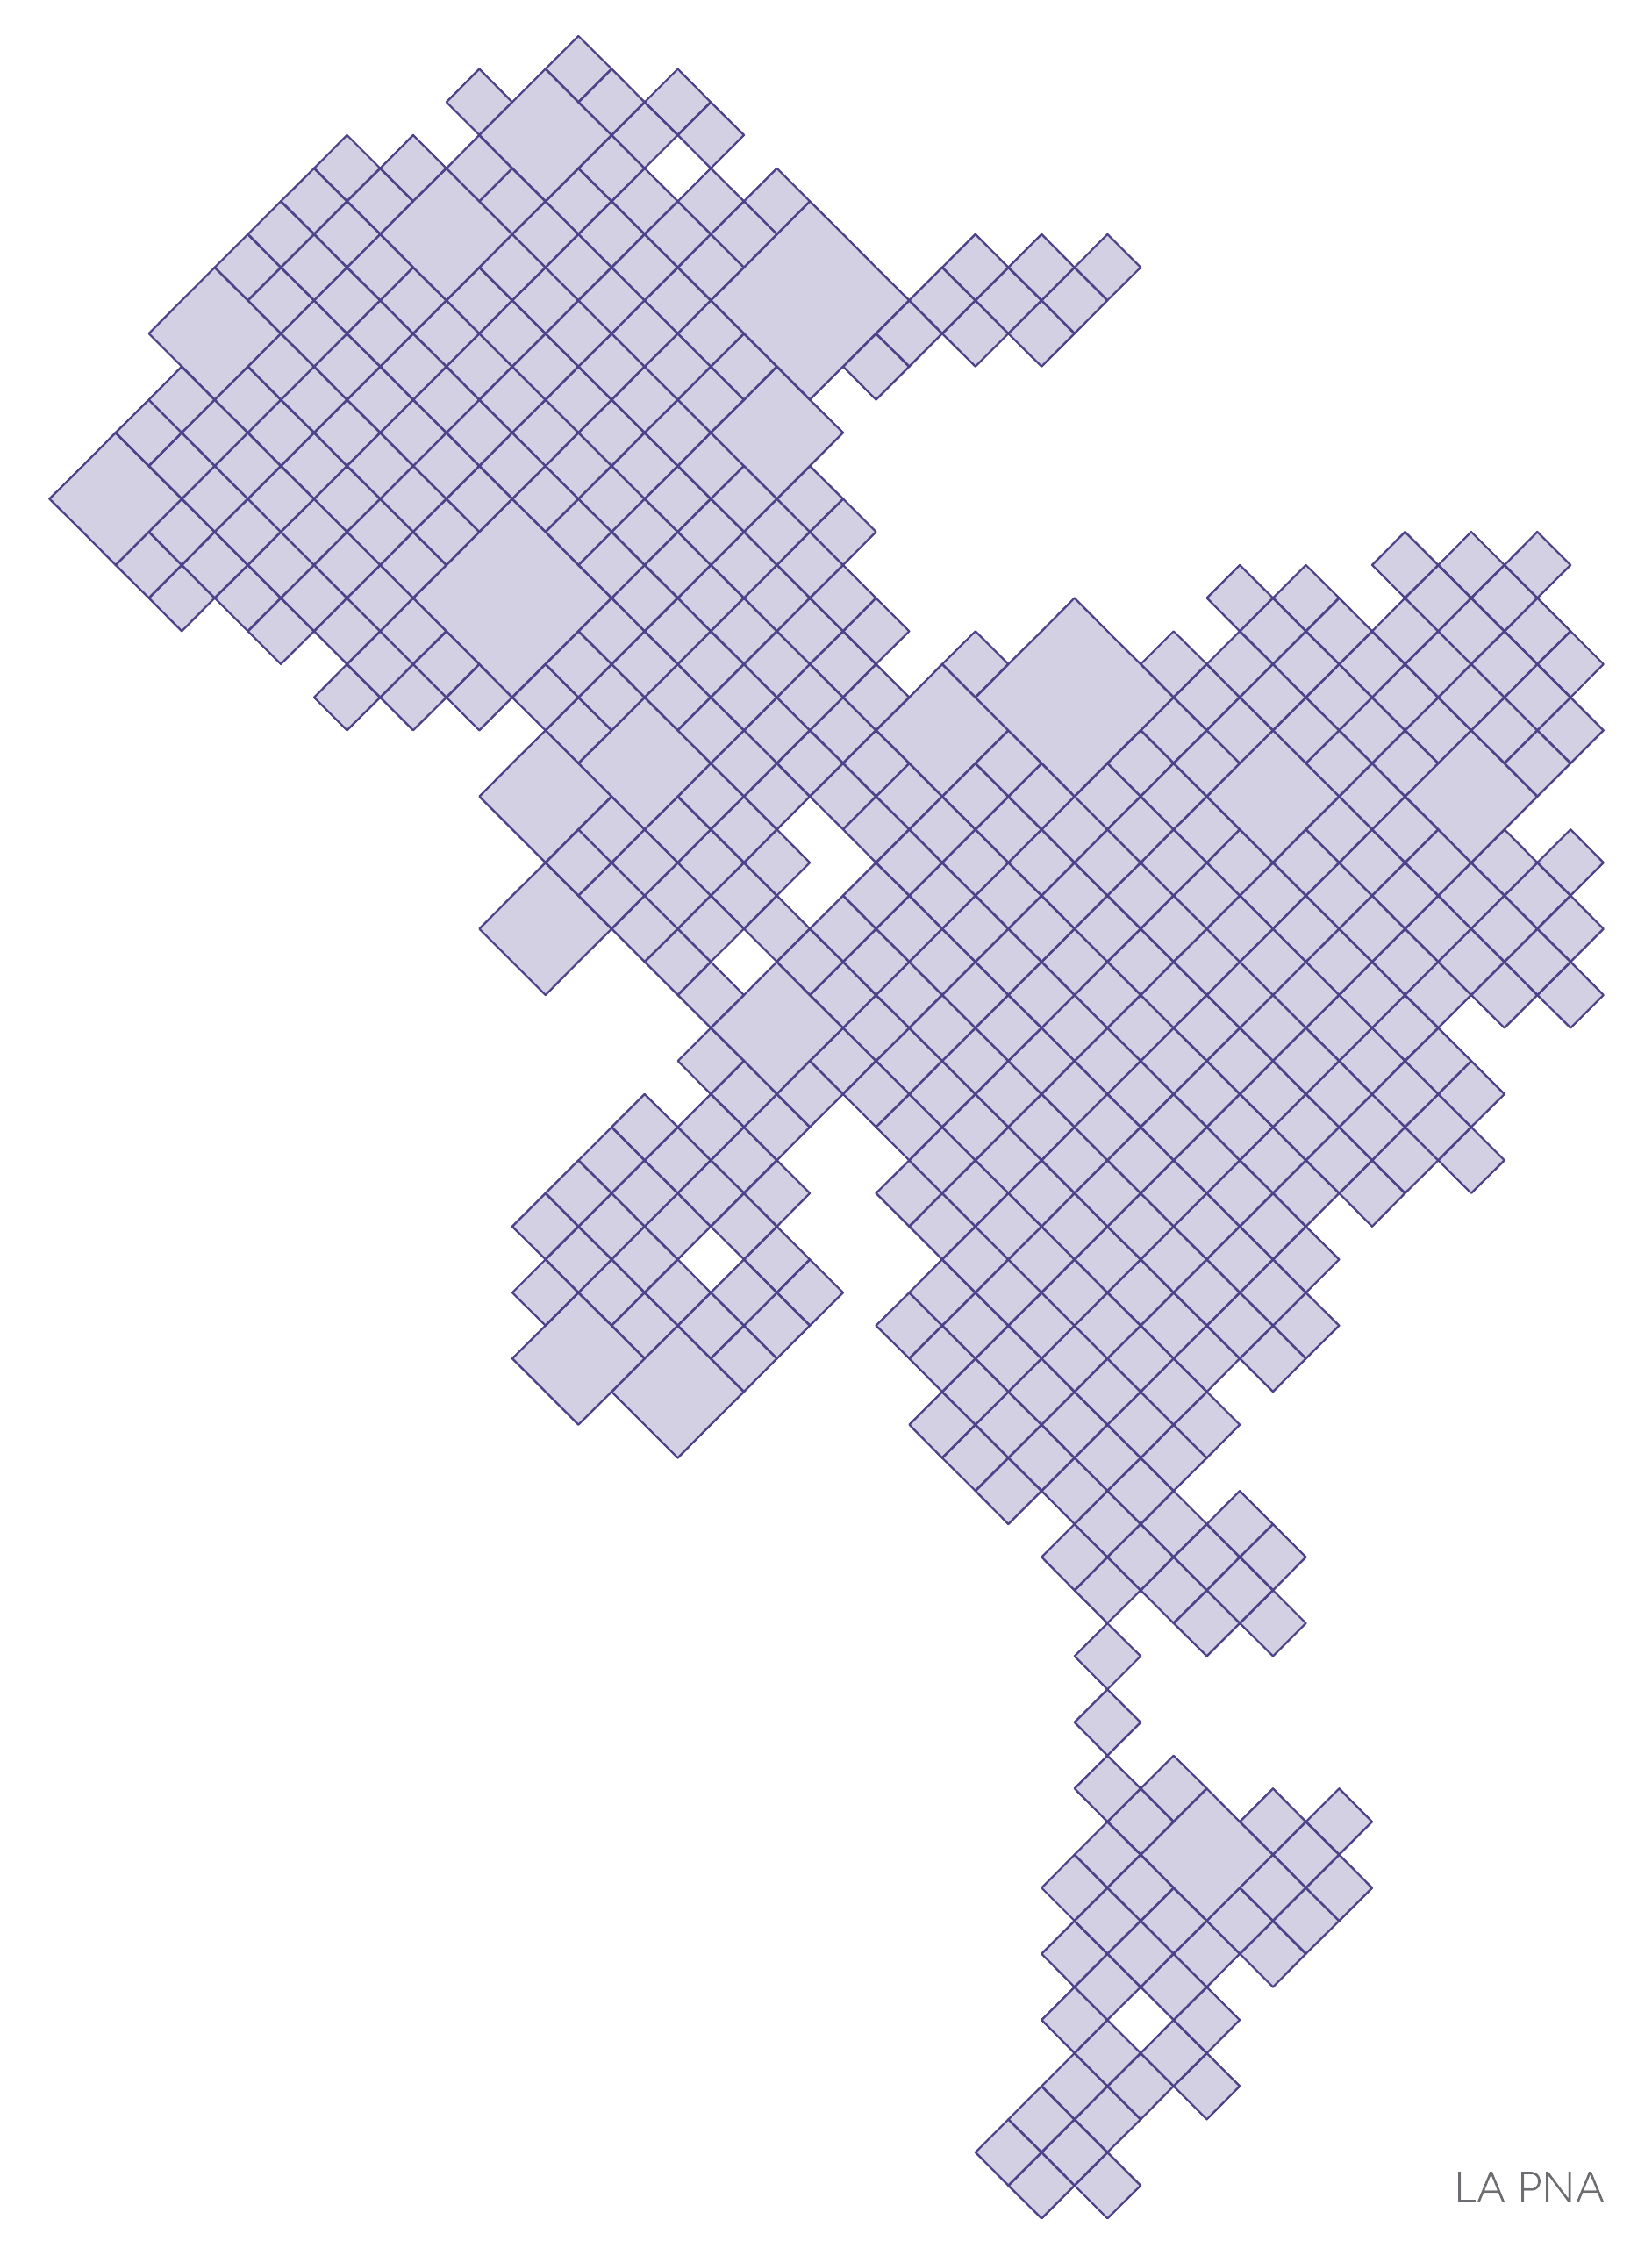
Showing Parks as "Park Pixels"
In site prioritization maps, each park in the “Universe of Sites” is assigned to one pixel.
For more information about Park Pixels, click here.
Park Need Will Increase Over Time
| Metric | 2023 | 2050 | Increase in Population 2023–2050 | Percent Change 2023–2050 |
|---|---|---|---|---|
| Park Access | 885,536 | 980,943 | 95,407 | 11% |
| DAC | 300,062 | 334,279 | 34,217 | 11% |
| CES75+ | 360,619 | 389,228 | 28,610 | 8% |
| Park Supply | 3,787,124 | 4,327,532 | 540,408 | 14% |
New Park Priority Areas
The PerSquareMile tool, developed by GreenInfo Network and the UCLA Institute of the Environment and Sustainability, was used to identify potential areas where RAP might invest in developing new parks.
The tool was created to understand access to parks and the outdoors at a granular level across California. It was designed to identify areas with the greatest number of people in need of nearby parks. By overlaying a one-square-mile grid that covers the City of Los Angeles with high-resolution population location data, the tool was used to pinpoint where residents have no or insufficient access to parks within a half-mile of their homes.
PerSquareMile Analysis
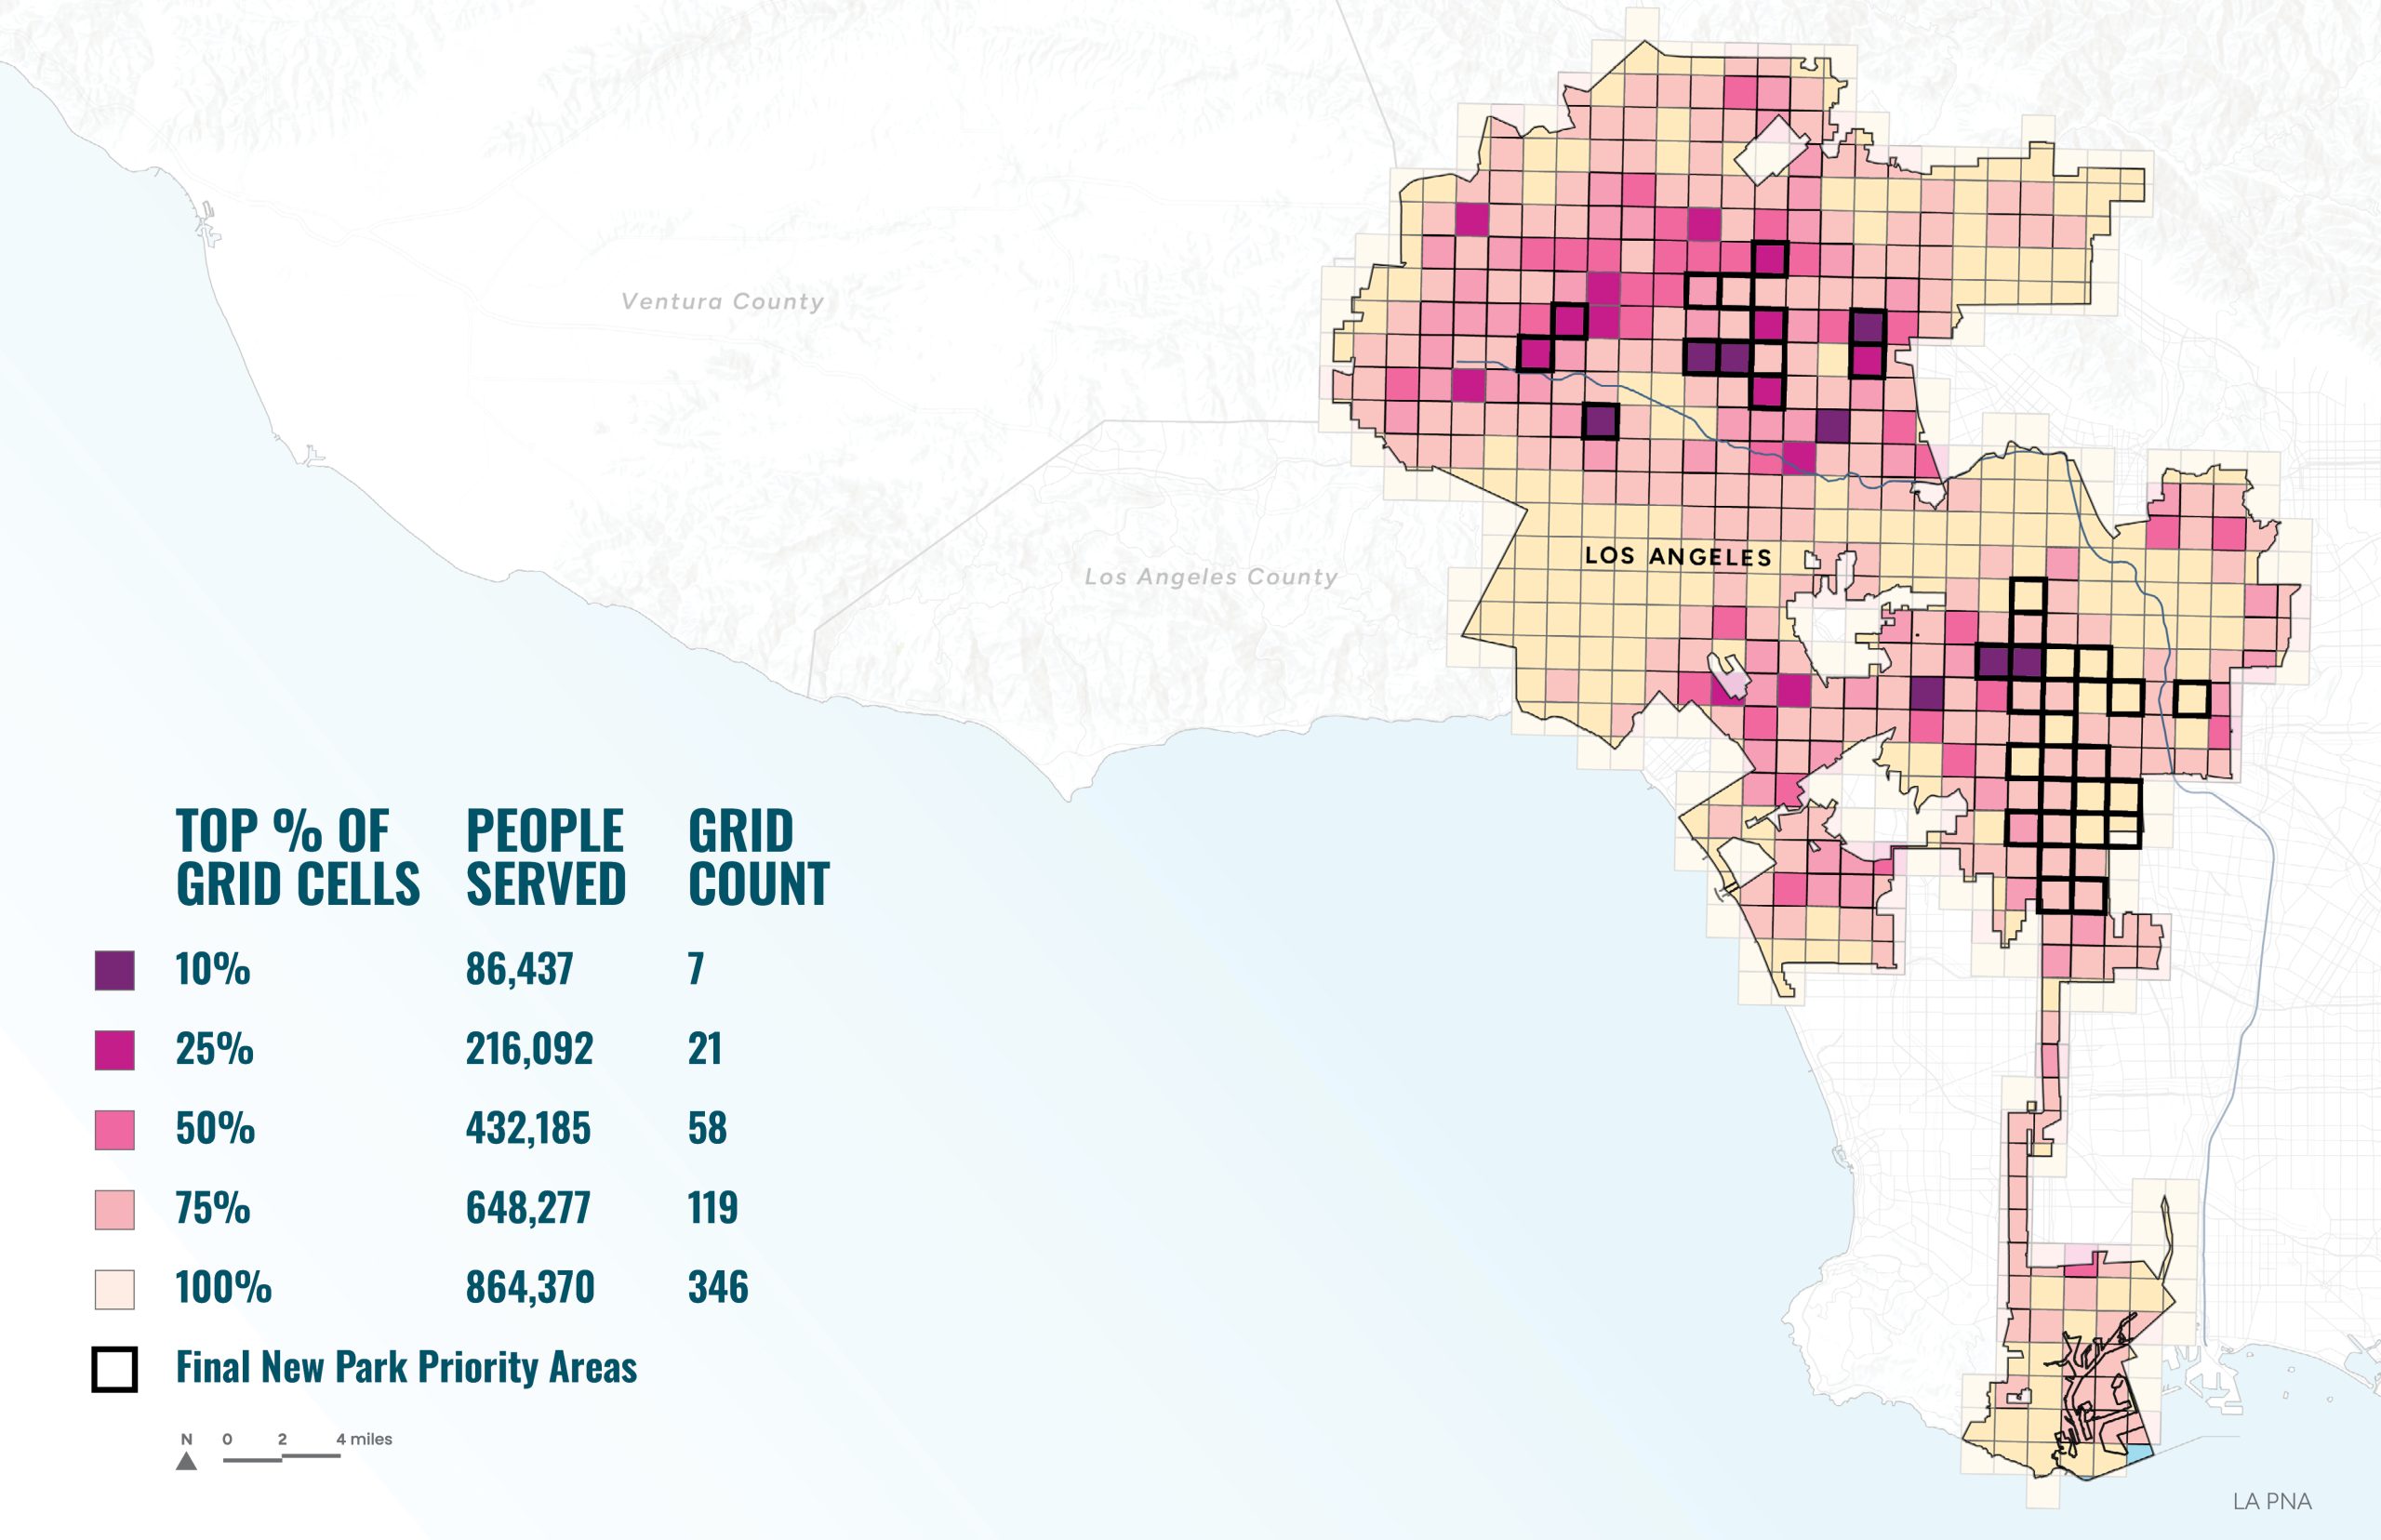
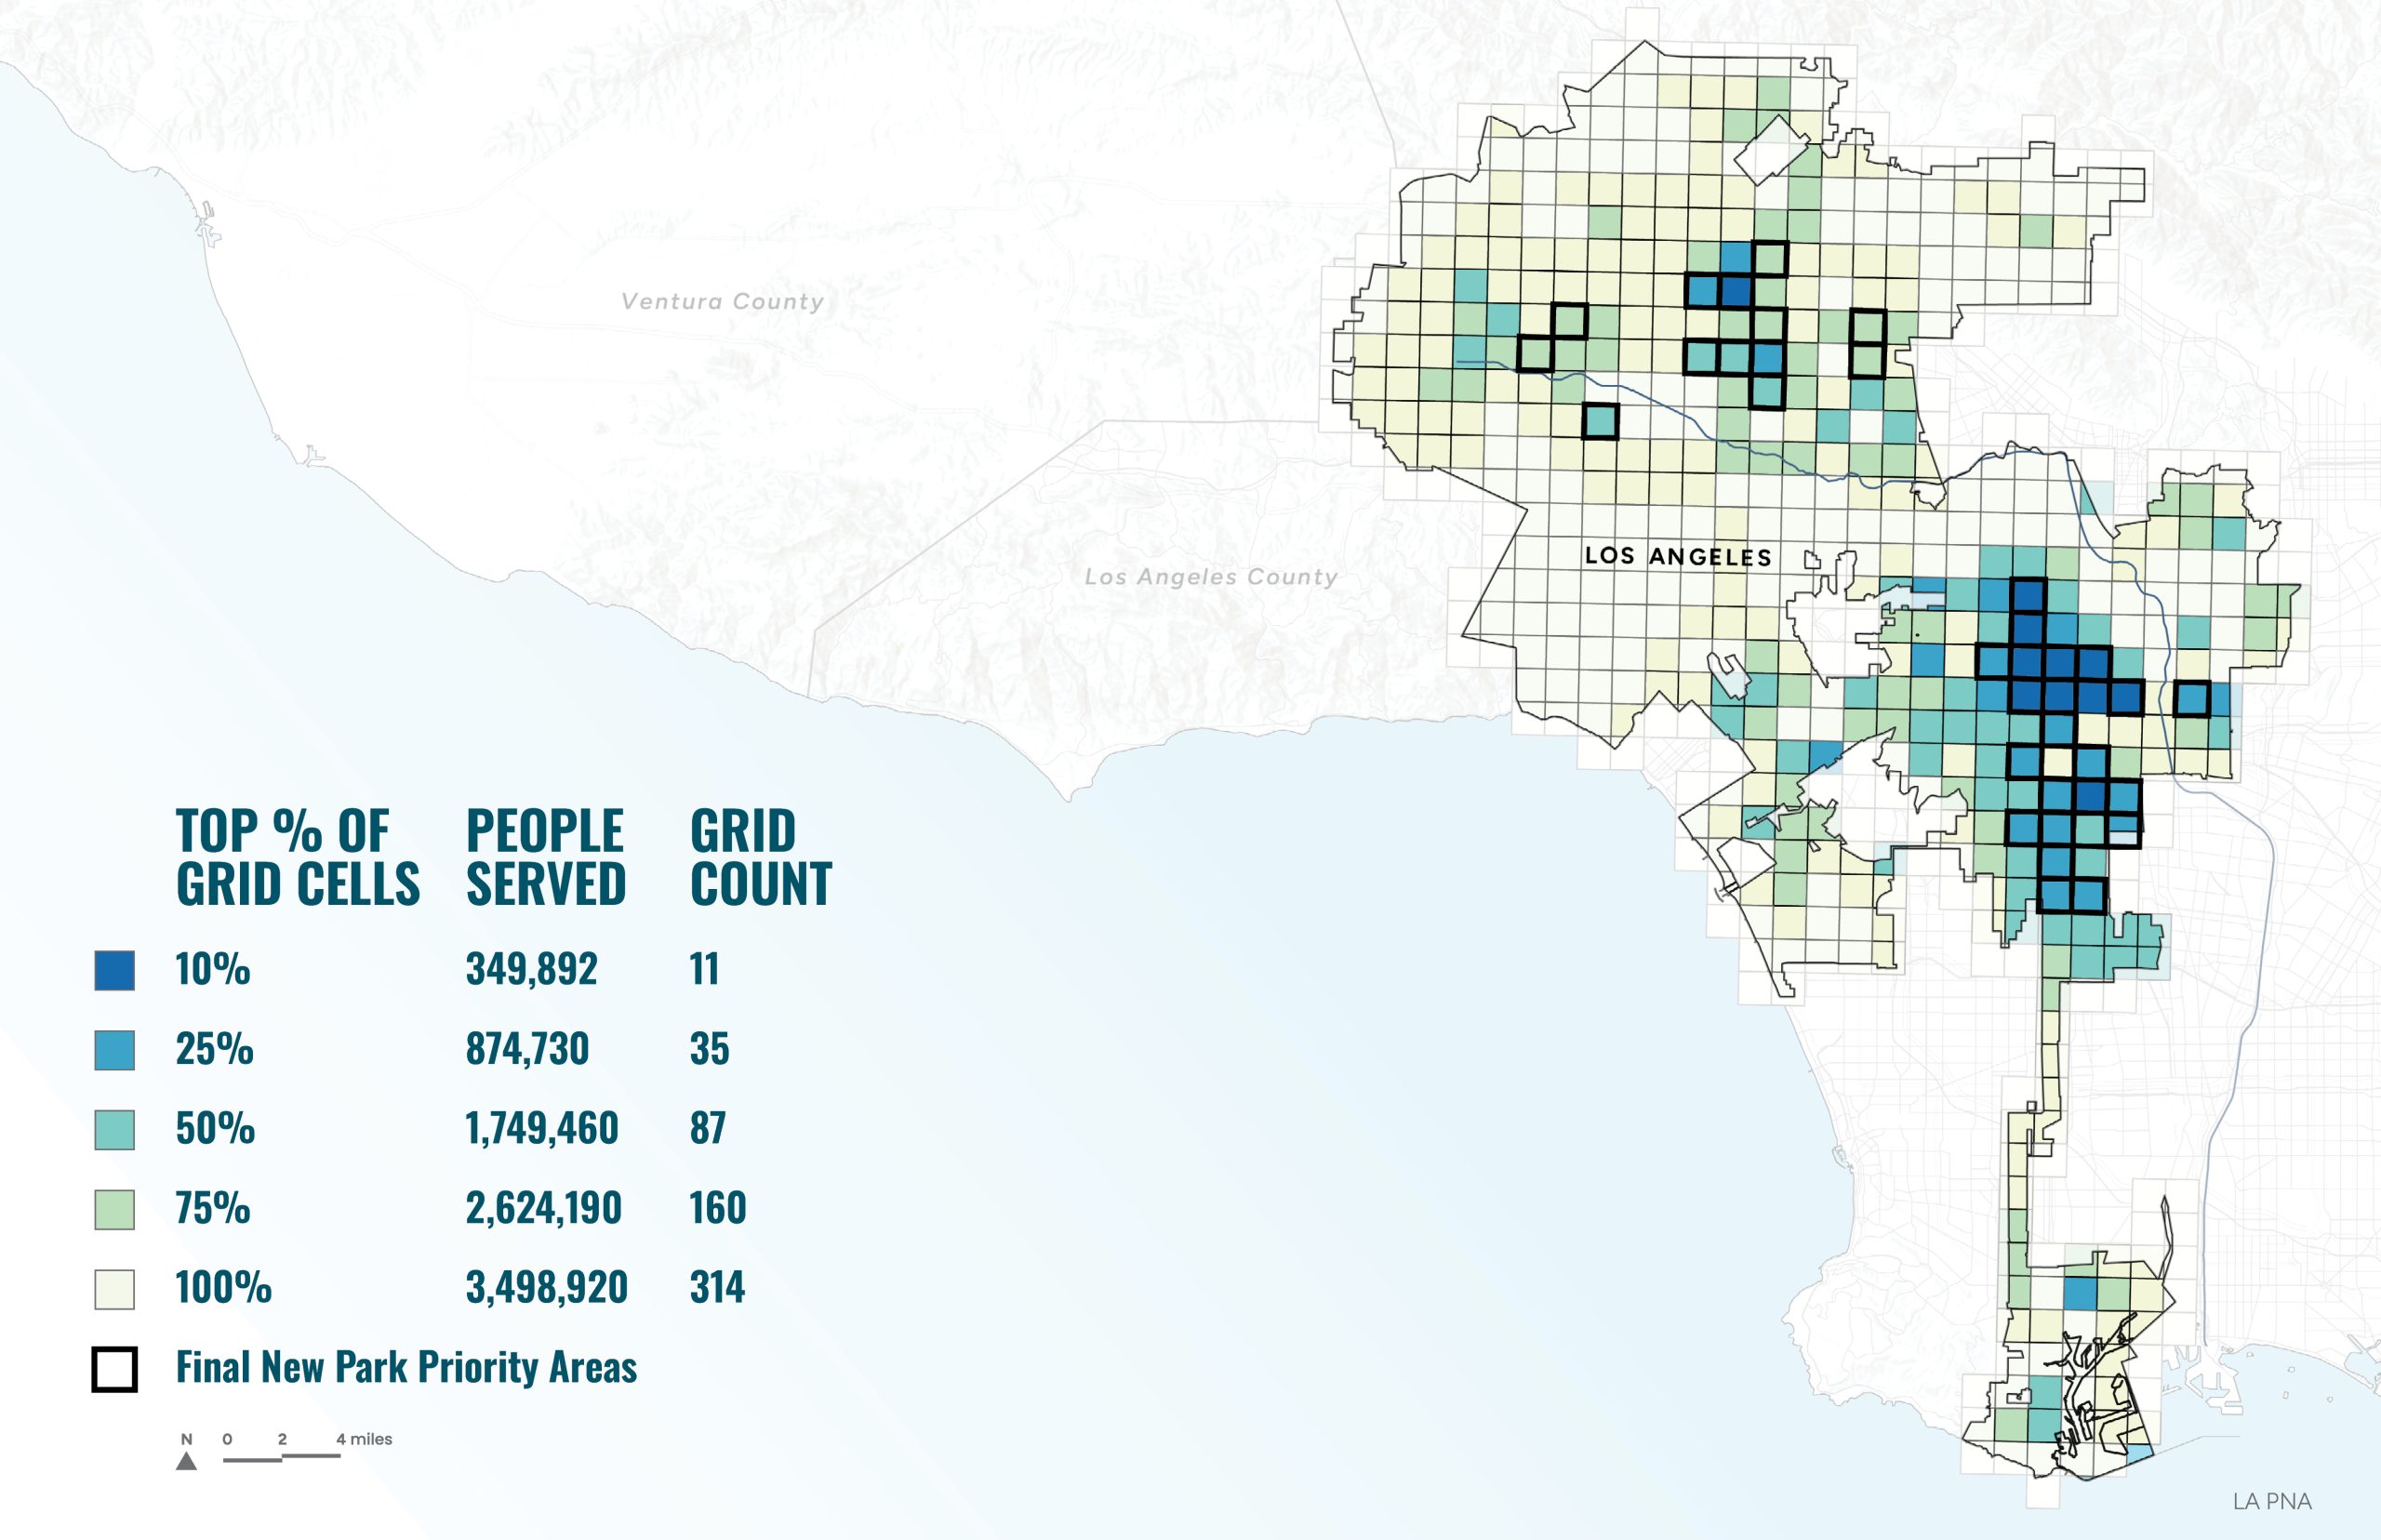
here are 602 PerSquareMile grid cells that overlap the City of Los Angeles. For the PNA, the PerSquareMile tool was used to assess two metrics:
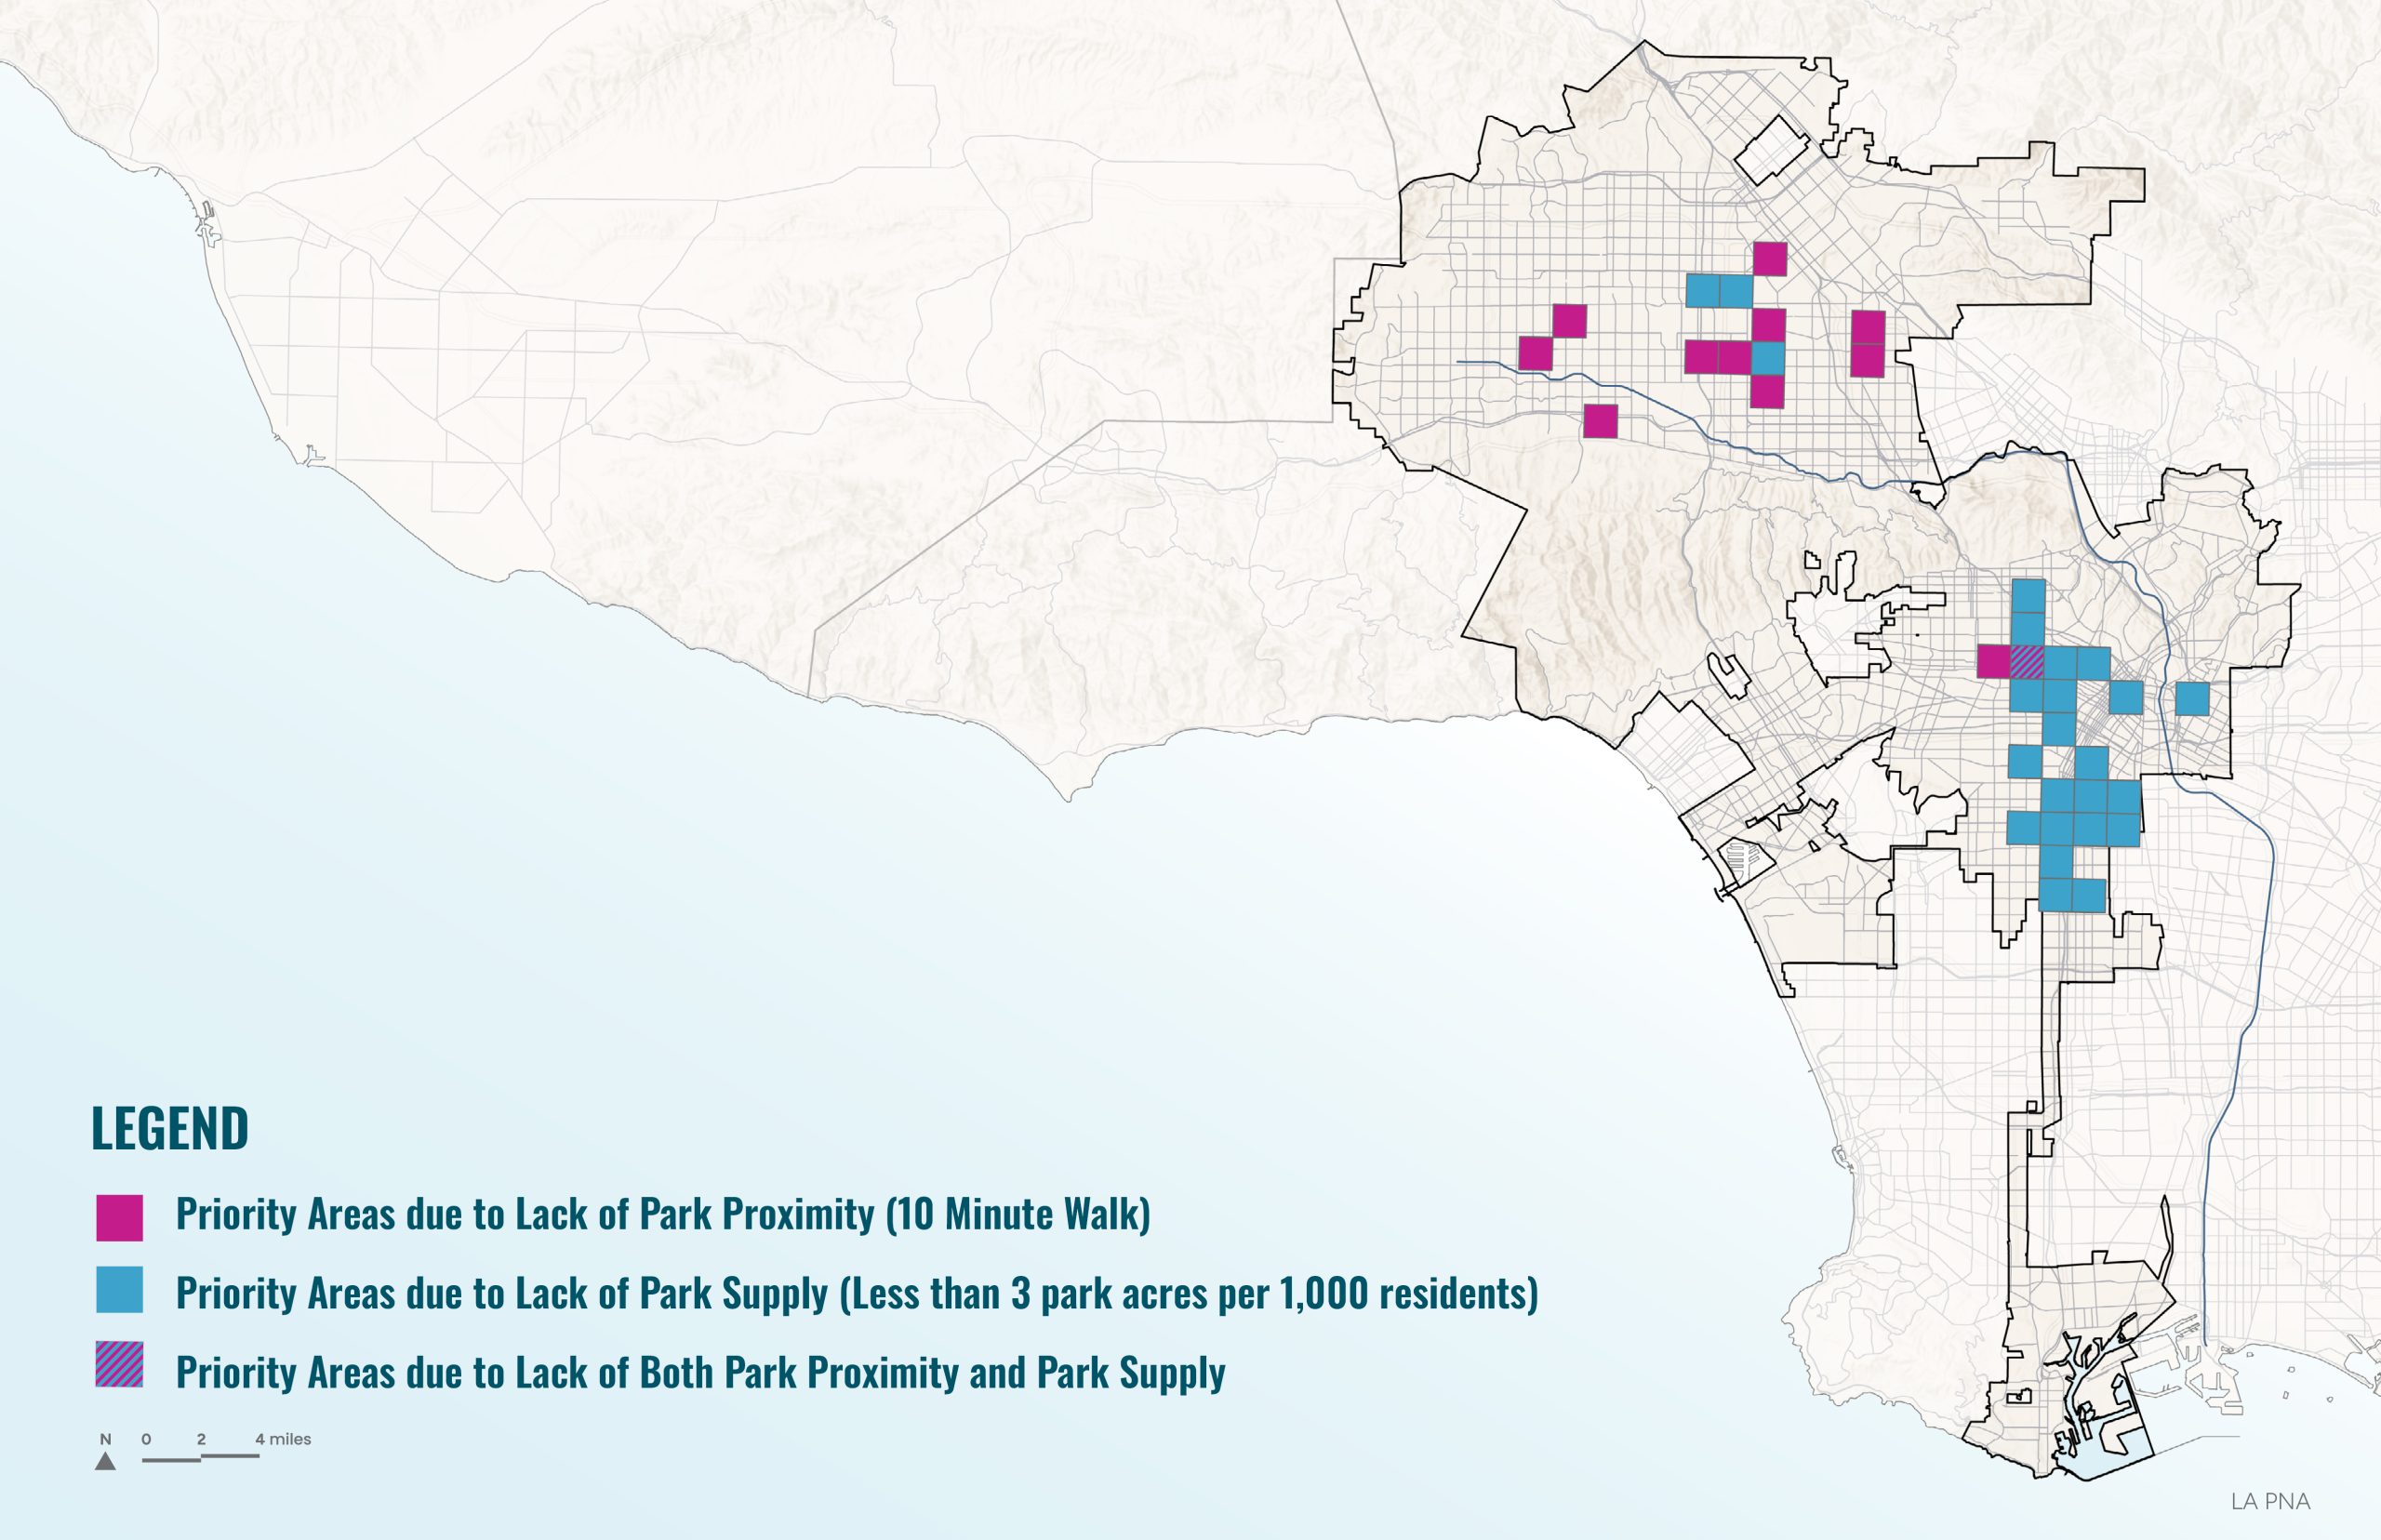
Park access – the number of people without a park within a 10-minute walk of their homes
Park supply – the number of people with less than 3 park acres per thousand people within a 10-minute walk of their homes.
There are over 880,000 people who lack park access and over 3.7 million people have low park supply in the City of LA. If we do nothing by 2050 an additional 100,000 people will lack park access and over 500,000 will be in areas with low park supply due to population growth.
The Steering Committee considered multiple scenarios to serve residents who lack park access or sufficient park supply. The chosen scenario addresses the top 25% of residents lacking in either the park access or park supply metrics and are also either in the top quartile of exposure based on their CalEnviroScreen4.0 (CES) or identified as a Disadvantaged Community (DAC). The analysis considered all parks, including those managed by RAP and those managed by other agencies. Through this process, 36 New Park Priority Areas were added to the Universe of Sites alongside the 482 existing parks.
Park Access
The number of people without a park within a 10-minute walk of their homes.
Park Supply
The fewest park acres per thousand people
If we do nothing to address park access, by 2050. 117,000 more people will live without a park nearby!
Showing New Park Priority Areas Alongside "Park Pixels"
In site prioritization maps, each New Park Priority Area in the “Universe of Sites” is shown as an “X” on top of the Park Pixels
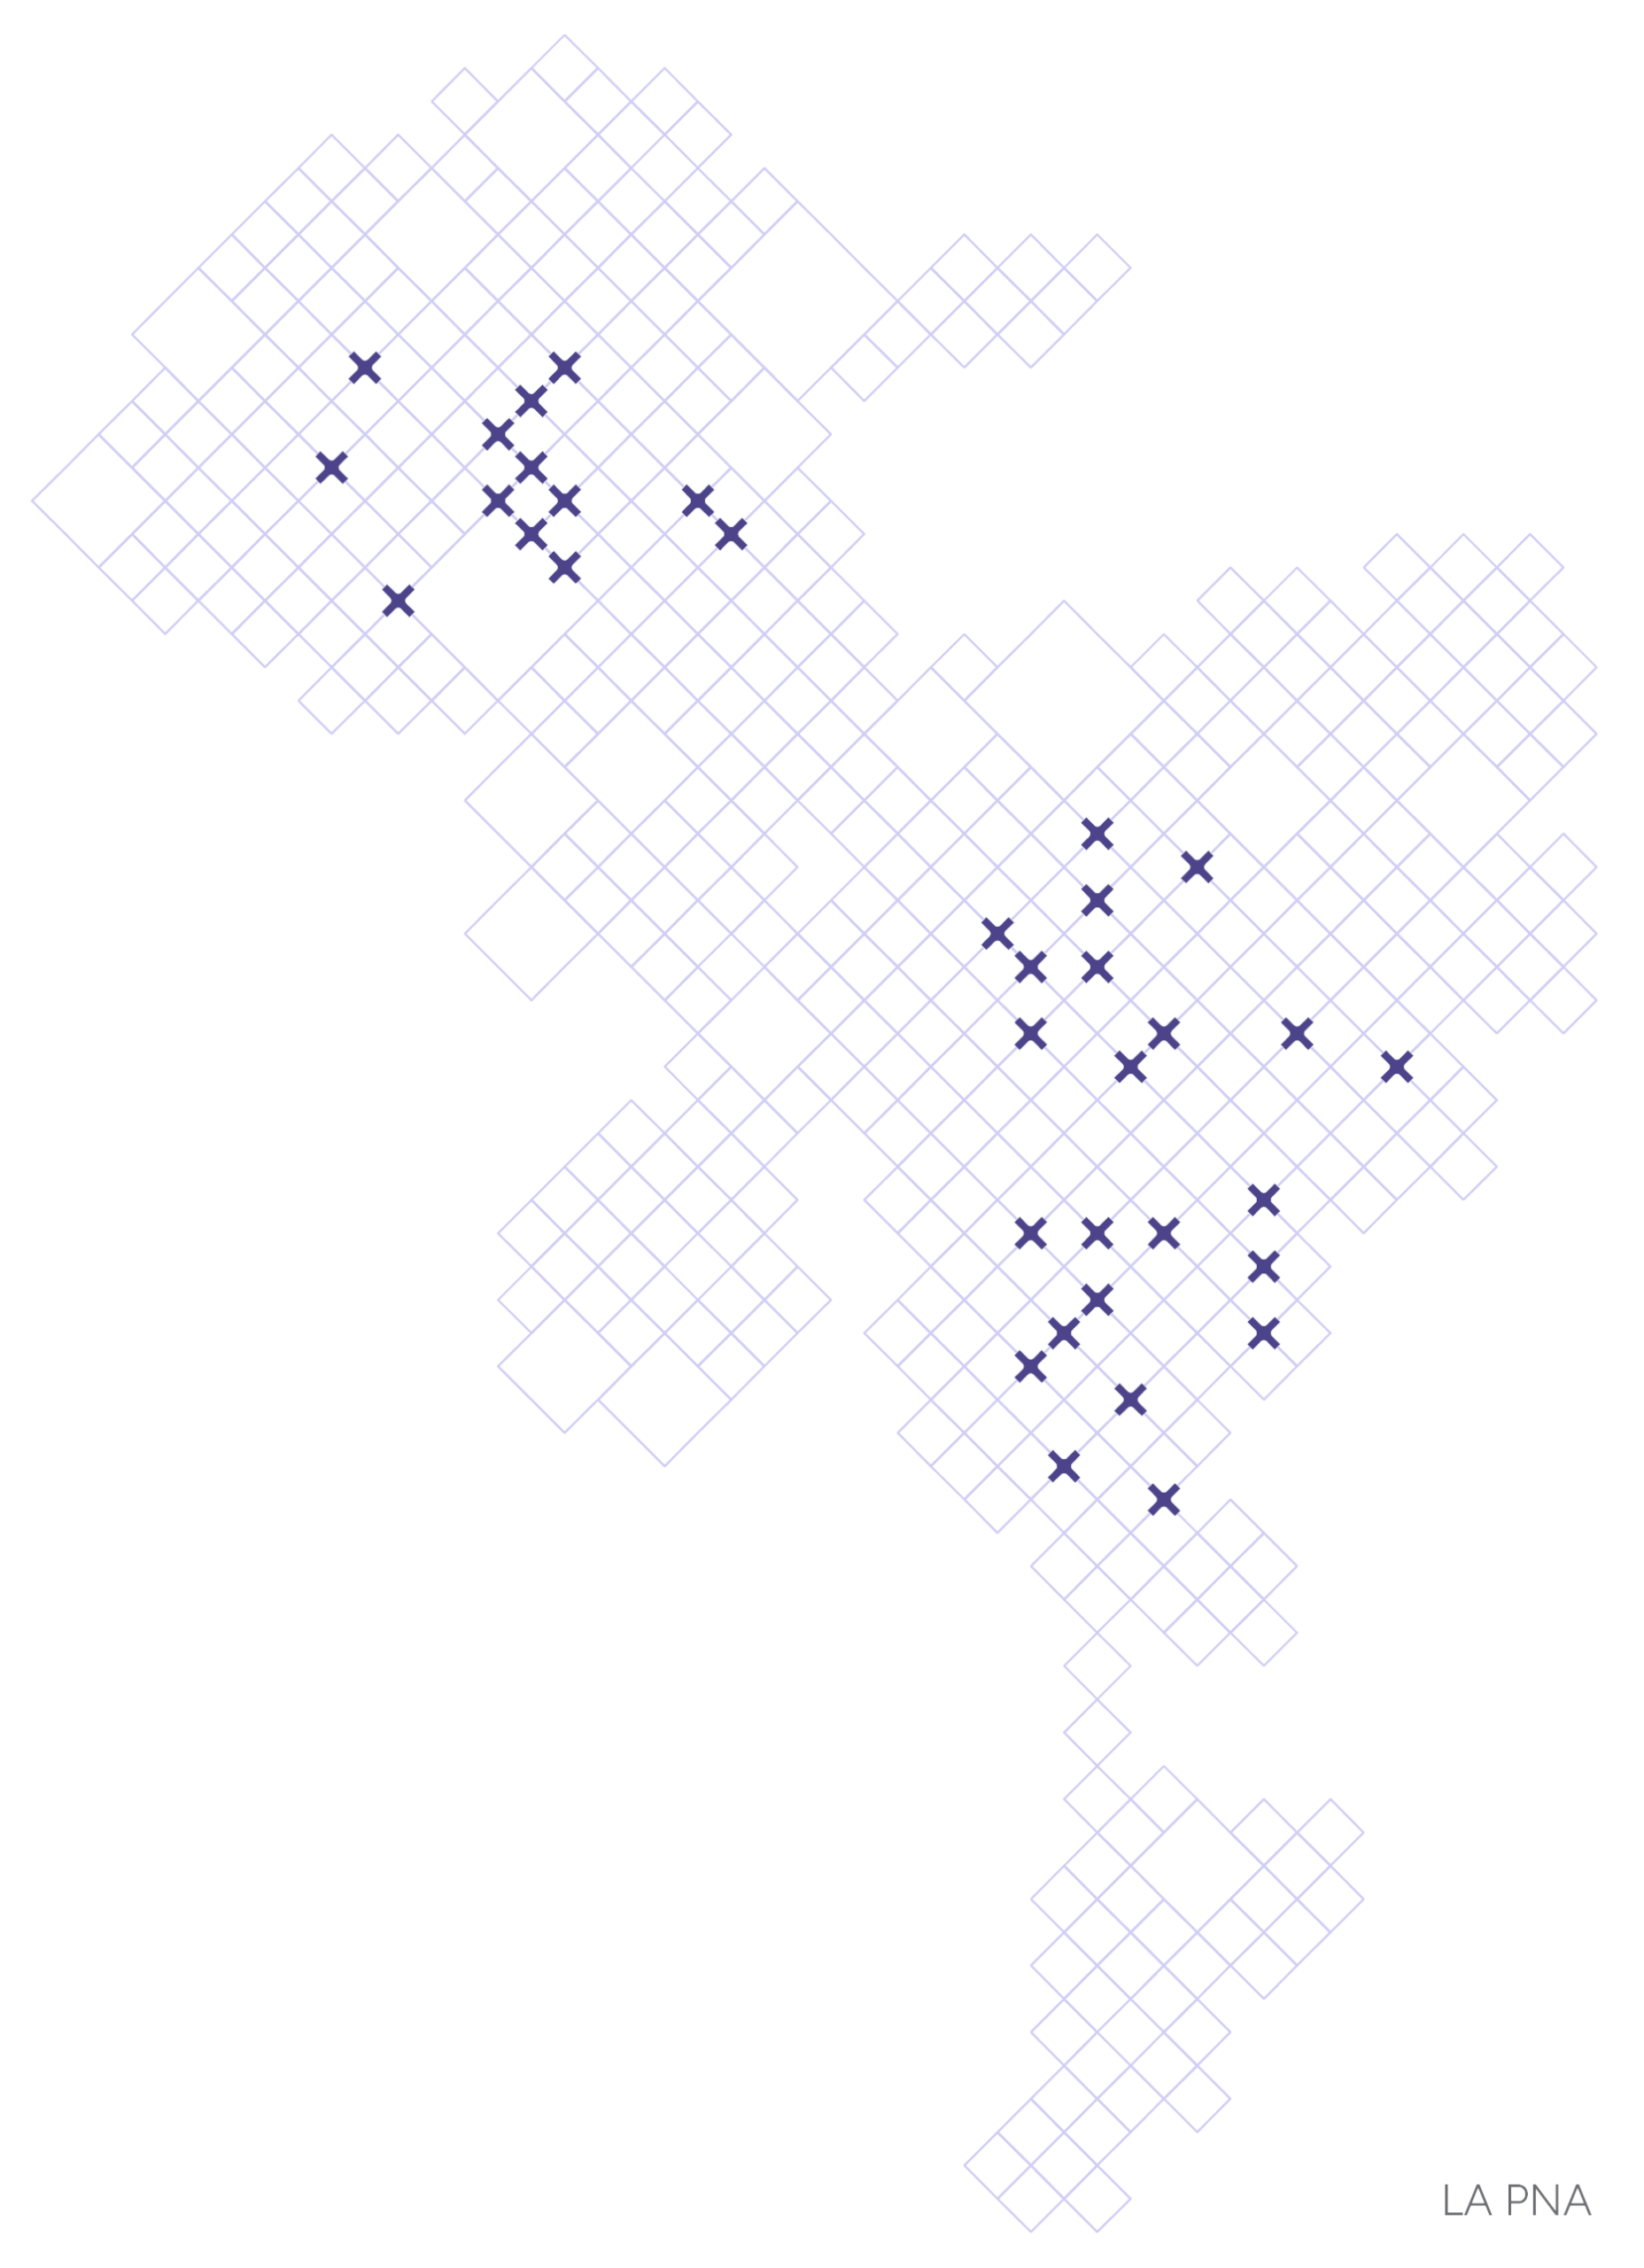
This map identifies New Park Priority Areas for addressing the top 25% of the need for new parks Access and additional park acreage (Supply), as part of the universe of sites for the PNA.
This analysis also takes into account those who live in Disadvantaged Community areas (DAC) as well as those who live in high exposure areas based on CalEnviroScreen (CES75+).
Within the Grid Cells
Each PerSquareMile grid cell has opportunities within it for additional parkland. These opportunities include entirely new parks, partnership or joint-use agreements with other entities, or adaptation of single-use infrastructure or remediated brownfields sites into multi-benefit sites. Within the 36 grid cells, there are over 170 K-12 school campuses and 509 other public parcels that could be potential sites for future parks and recreation spaces. Five of the 36 grid cells contain public parcels already zoned as “open space.” Privately owned public spaces (POPS) could also be used to complement, not replace, new parks—particularly in dense neighborhoods with significant redevelopment pressures. The Downtown Los Angeles Community Plan, for example, addresses the role of POPS.
Outside of the Grid Cells
Throughout the PNA process, neighborhood councils and community advocates have shared additional prospective park sites across the City. While the PNA has identified these 36 square-mile New Park Priority Areas to look at first to close gaps in access to and supply of parks, RAP will continue to consider other opportunities outside of these grid cells to expand and establish new parks where feasible across the City, subject to funding. To read more about how RAP will use the PerSquareMile and Site Prioritization in future development and decision making processes, see the Action Plan.