The district is home to the headwaters of the Los Angeles River and a mix of foothill and valley parks. The area is experiencing some population growth which is putting pressure on park facilities and raising concerns for residents about how developer fees for projects occurring in the area such as Warner Center will be spent in the area to improve parks.
Many residents expressed concerns about park operations and maintenance and park rule enforcement. Concerns were raised about the prevalence of persons experiencing homelessness, particularly along the Los Angeles River trail. Other concerns include repeated increased taxes for city services and understanding how dollars are allocated around the city.
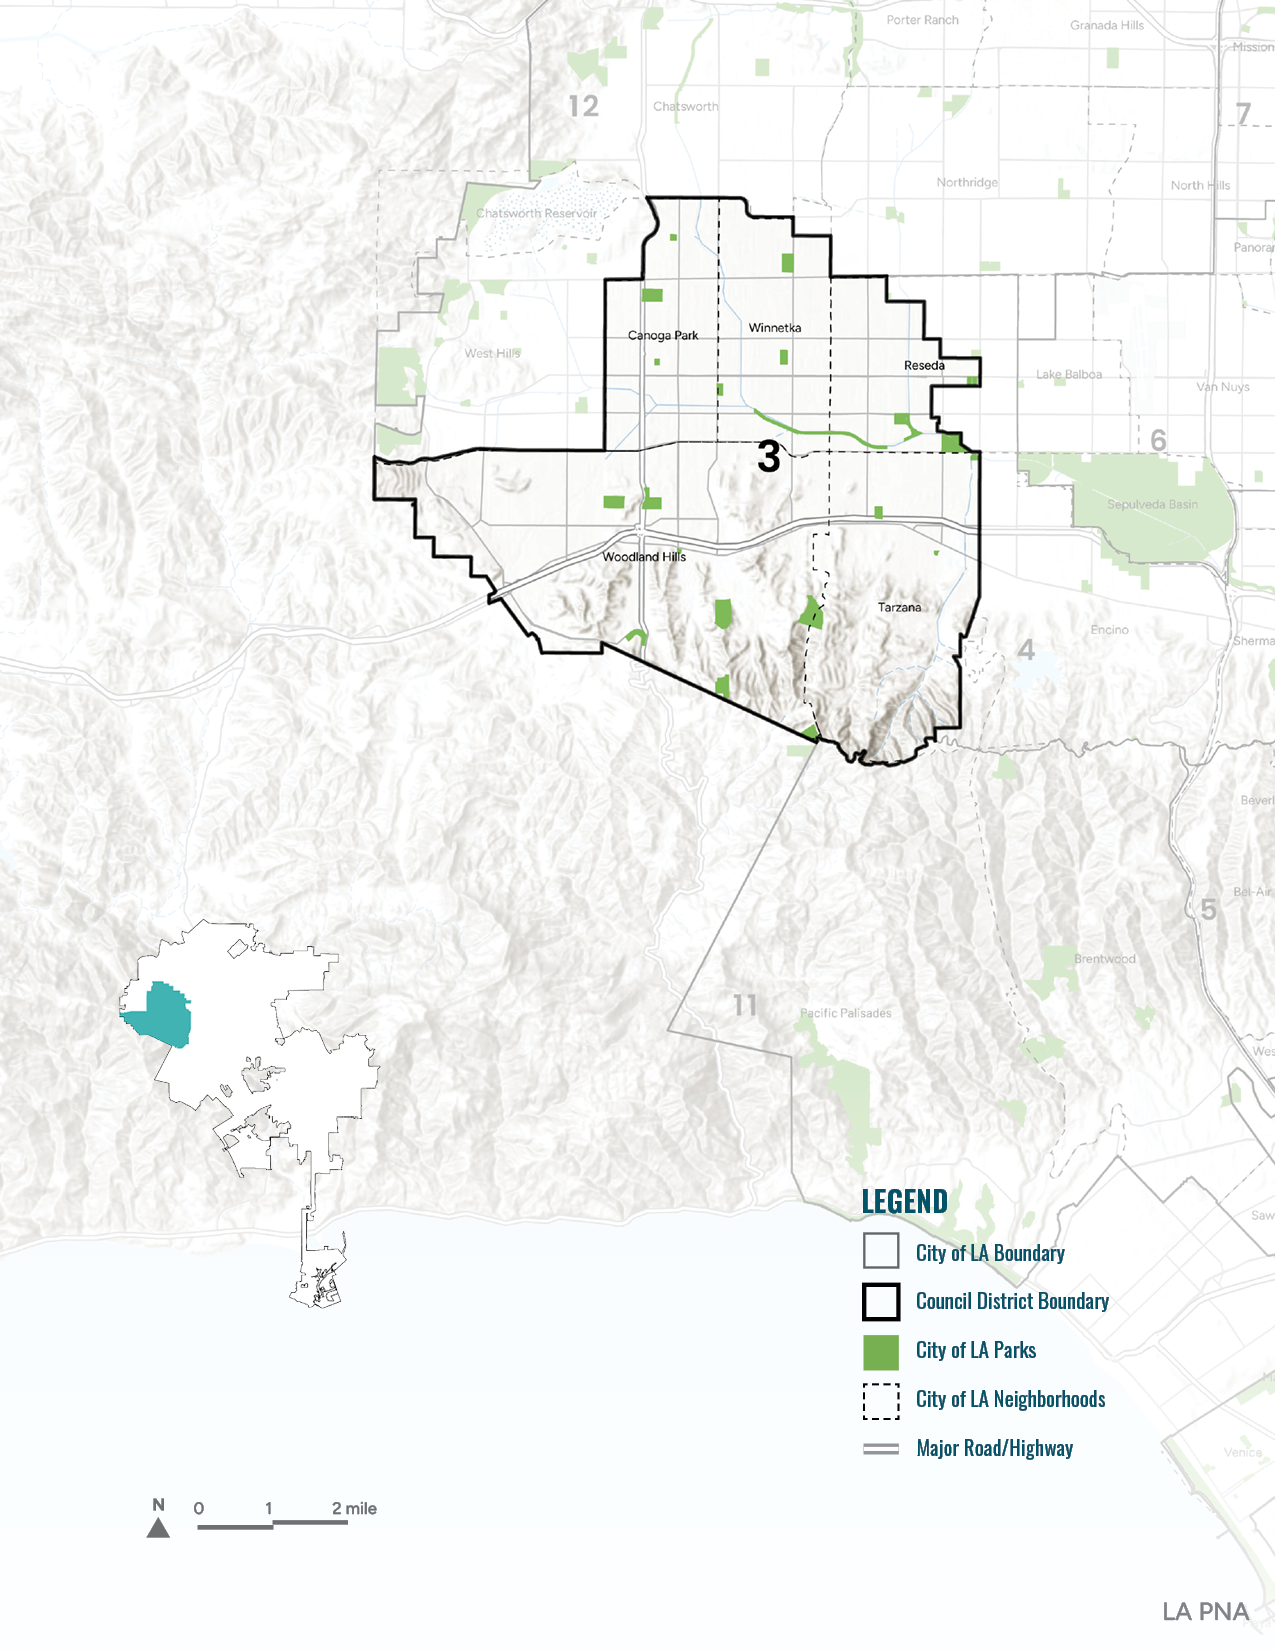
Population projections for 2050 reveal that growth is expected to be highest in the neighborhoods of Woodland Hills and Canoga Park, with Tarzana seeing some modest growth.
Council District 3 Neighborhoods
At a Glance
Top 3 Languages Spoken
English, Spanish, Other Indo-European Languages
What we heard
Current and Future Needs: Survey Results
CD 3 respondents feel worse than the city as a whole about the physical condition of both City of LA parks and recreation centers.
Parks
Recreation Centers
One-third of CD 3 respondents feel that there are enough parks and recreation centers within walking distance of their homes.
Most CD 3 respondents have visited a City of LA park in the past year, while only about half have visited a City of LA recreation center.
Parks
- 96%Have Visited
- 4%Have Not Visited
- 6%Daily
- 40%Weekly
- 35%Monthly
- 11%Yearly
-
4%Less
than Once a Year
Rec Centers
- 54%Have Visited
- 46%Have Not Visited
- 13%Weekly
- 30%Monthly
- 9%Yearly
-
2%Less
than Once a Year
Less than half of CD 3 respondents support a bond, levy, or tax to fund parks and recreation facilities.
Top 3 Most Important...
Outdoor Facilities
- Unprogrammed green spaces
- Non-paved, multi-use trails
- Paved, multi-use trails
Indoor Facilities
- Weight rooms/gyms
- Exercise & fitness equipment
- Walking/jogging track
Programs
- Fitness/wellness programs
- Seniors (age 50 & over)
- Arts & crafts classes