Feedback was gathered through conversation, via notes and letters, and through digital engagement such as online surveys, emails, and comments. What we heard in meetings and via surveying methods is summarized below.
Traditional In-Person and Virtual Community Meetings
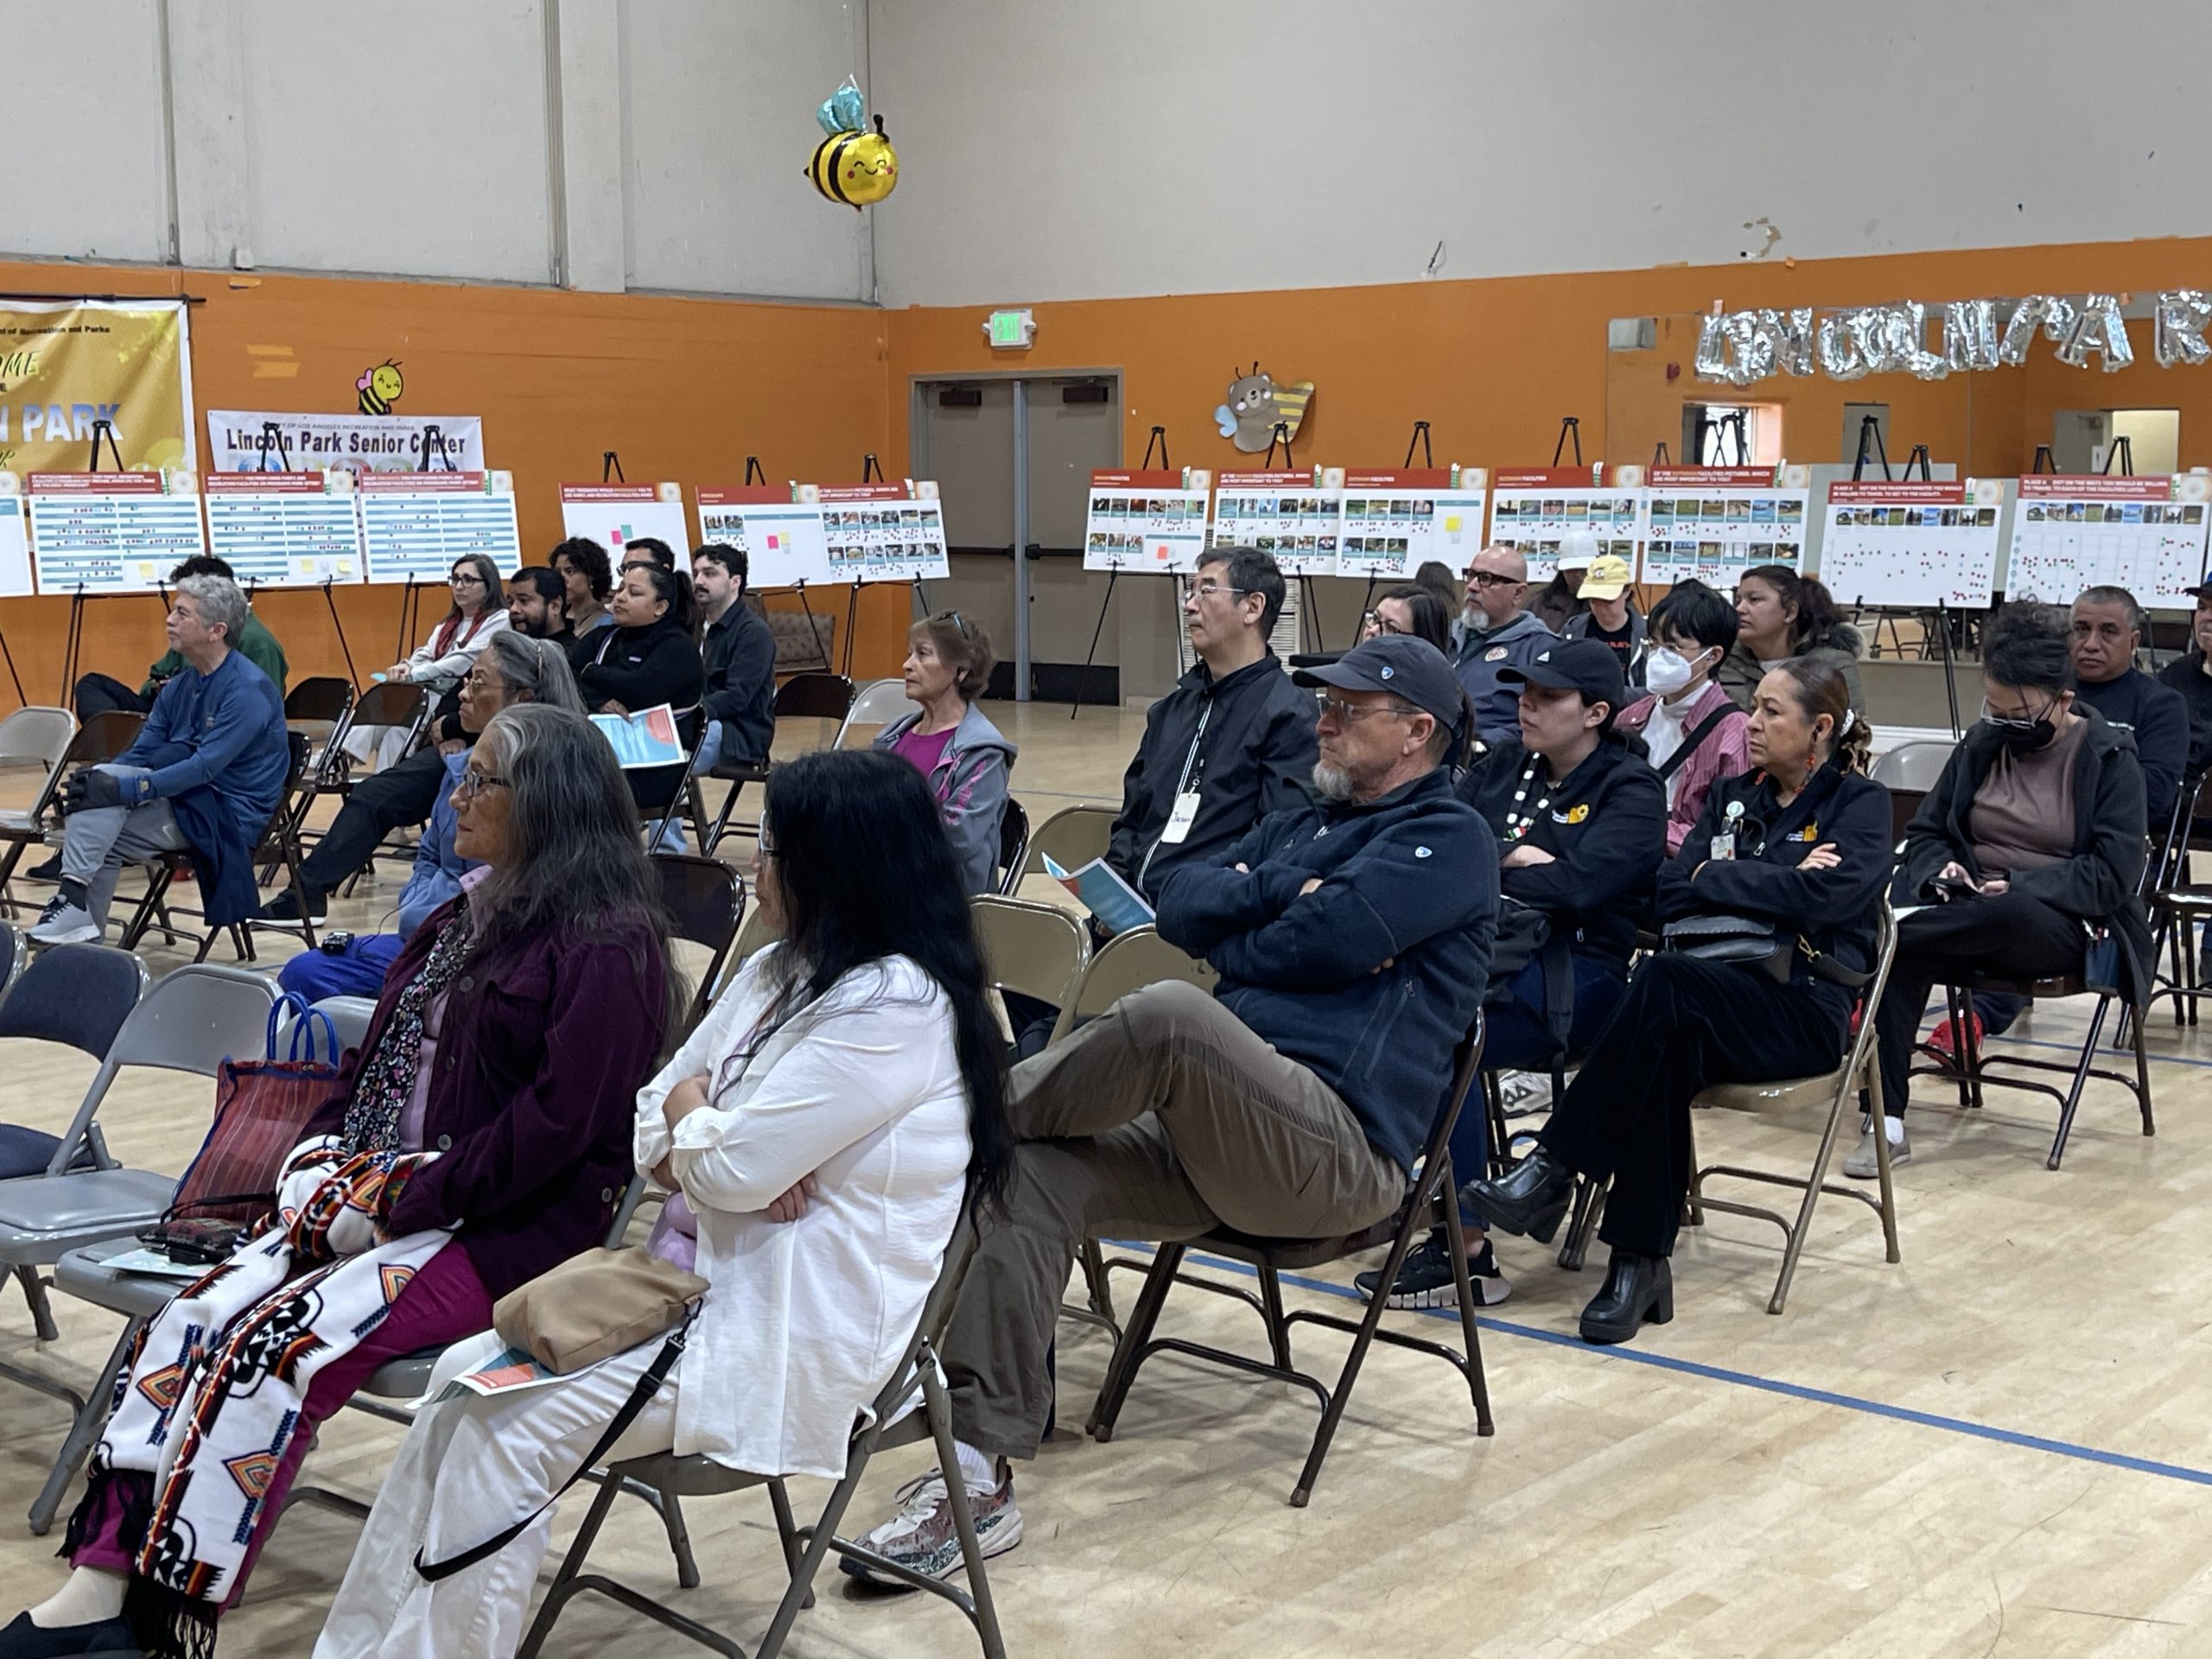
At community meetings, residents often shared the issues most pressing in their day-to-day experiences in parks and at recreation facilities. Concerns about operations, maintenance, lack of park space, and City finances were among the most frequent comments received.
Some community members expressed concern about environmental health and long term access to open space given increased pressure for housing and densification.
Many community members also expressed safety concerns, including parks with inadequate lighting, fire risk, and a lack of upkeep in current park facilities. Many other individuals came to advocate for increasing park spaces across the City. For additional takeaways from engagement events across areas of the City, see the Regional Snapshots.
Tribal Briefings and Listening Sessions
Tribal briefings throughout the process helped raise awareness of the project with tribal leaders in the region. At the Tribal listening session, participants advocated for increased representation and designation of cultural spaces for Indigenous communities in LA parks, potentially through focused contracting with Native artists on interpretive displays at parks and cultural sites. Another area of focus during these conversations was on workforce development within RAP and the City for Indigenous people. It was noted that in ongoing planning and engagement, specific engagement with Tribes can help to close gaps that can occur in traditional engagement and sampling.
Interest Group Meetings
Participants in Interest Group Meetings during the PNA represented neighborhood councils, park advisory boards, and community based organizations. Concerns over park pressure, accessibility, maintenance, and safety were top concerns expressed in these meetings. Many who attended the interest group meetings throughout the process advocated for increasing native species across RAP parks as well as supporting long-term ecologically regenerative land management practices. This feedback helped to inform the Site Planning guidelines.
Equity Sessions
Participants in the PNA Equity Sessions spanned community advocacy groups, agencies, non-profits, and arts organizations. These conversations were diverse, with perspectives on parks as foundational infrastructure for LA residents.
The feedback from these groups recounted past experiences collaborating with RAP as a department, and helped to identify actionable areas for improvement. These conversations were foundational to the formation of the PNA Guidelines.
THROUGHOUT ALL THREE PHASES OF ENGAGEMENT, OVER 72 EVENTS WERE HELD AND OVER 100,000 ANGELENOS PARTICIPATED THROUGH DIRECT ENGAGEMENT OR ONLINE OUTREACH!
Public Survey Takeaways and Statistics
In addition to community meeting discussions and feedback, surveys were used to gather both quantitative and qualitative community input on the current state of local parks and recreation facilities, as well as to identify opportunities for improvement and expansion. Questions solicited opinions about the conditions of parks and recreation centers, how people access parks, barriers to access, and the services and benefits provided by RAP’s programs and facilities
Surveys were mailed to a random sample of households in the city to get a statistically valid representation of Angelenos’ opinions, and an open survey was available on the PNA website. The open survey had short and long versions tailored to the amount of time people had available.
Over 5,600 surveys were completed across the statistically valid survey, the short online survey, and the long online survey.

How to Read the Survey Takeaways
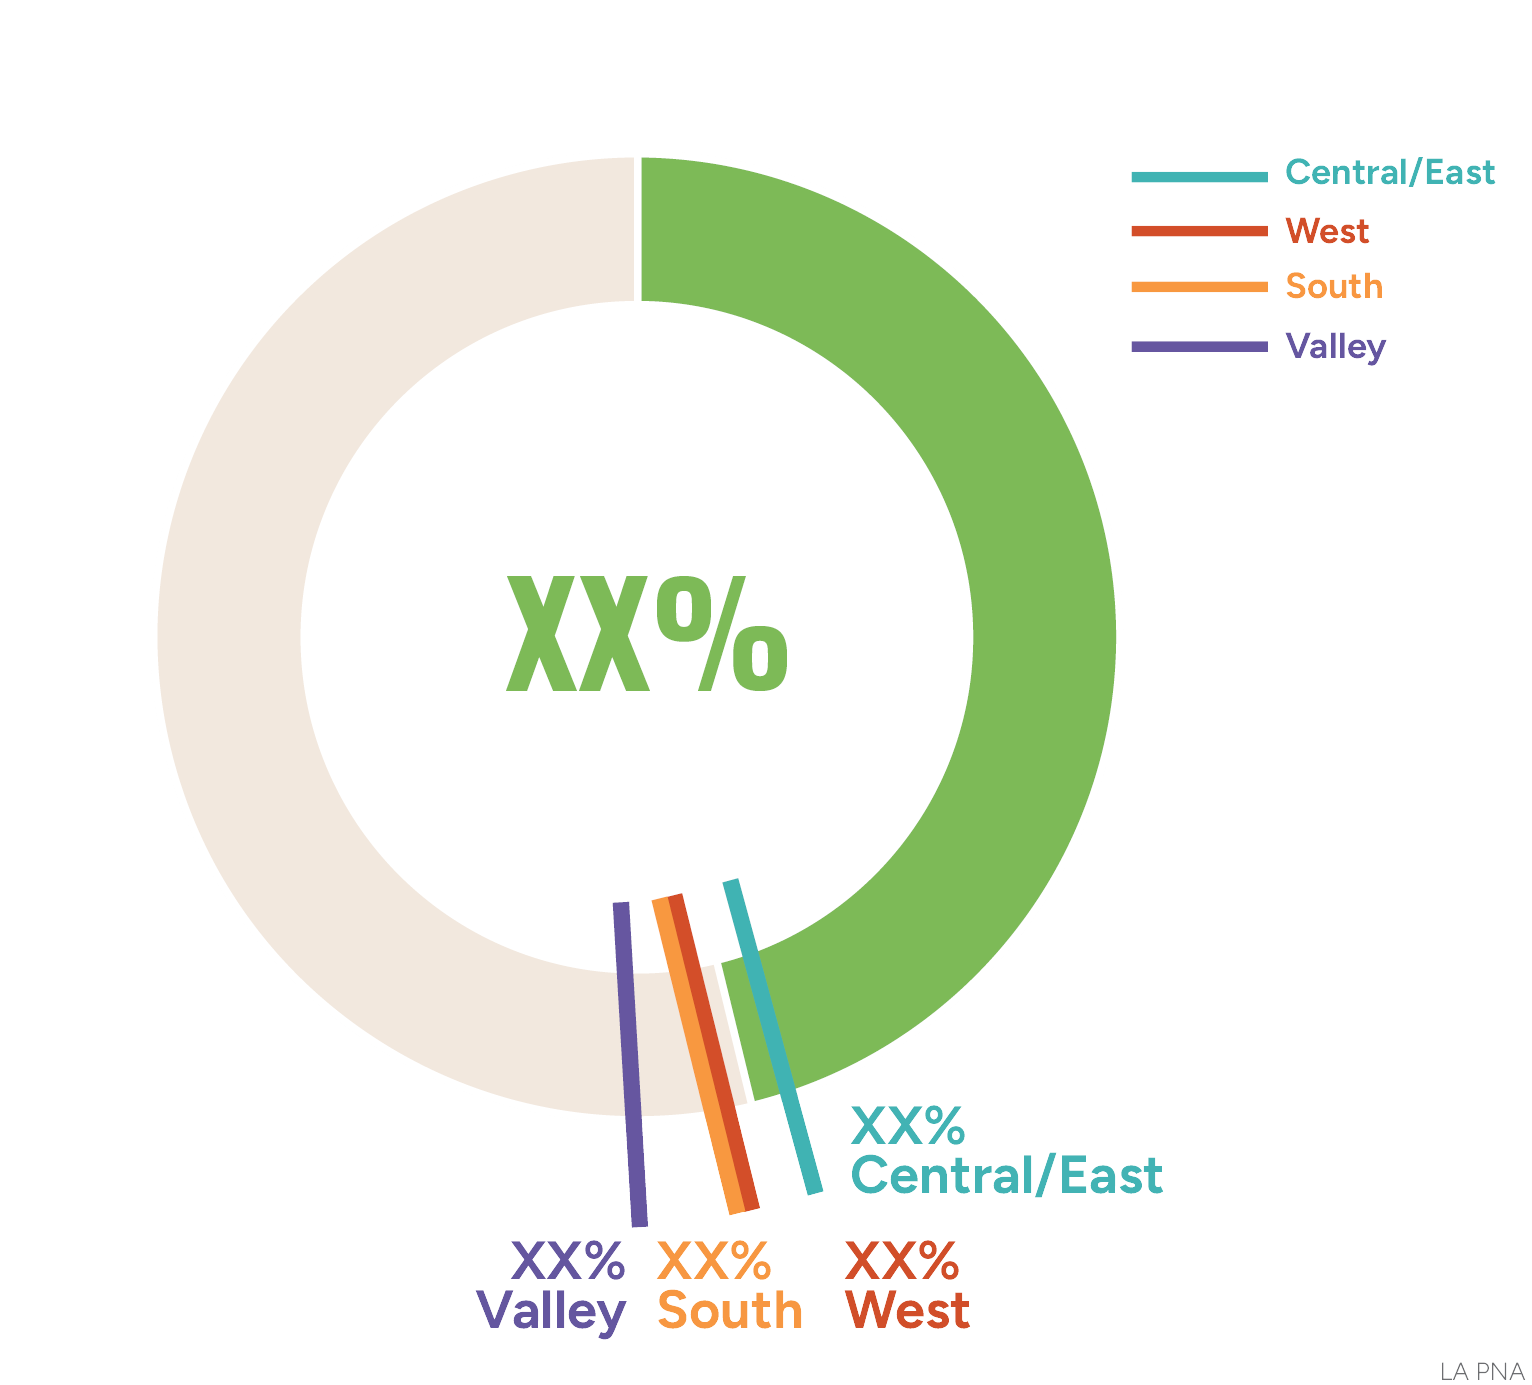
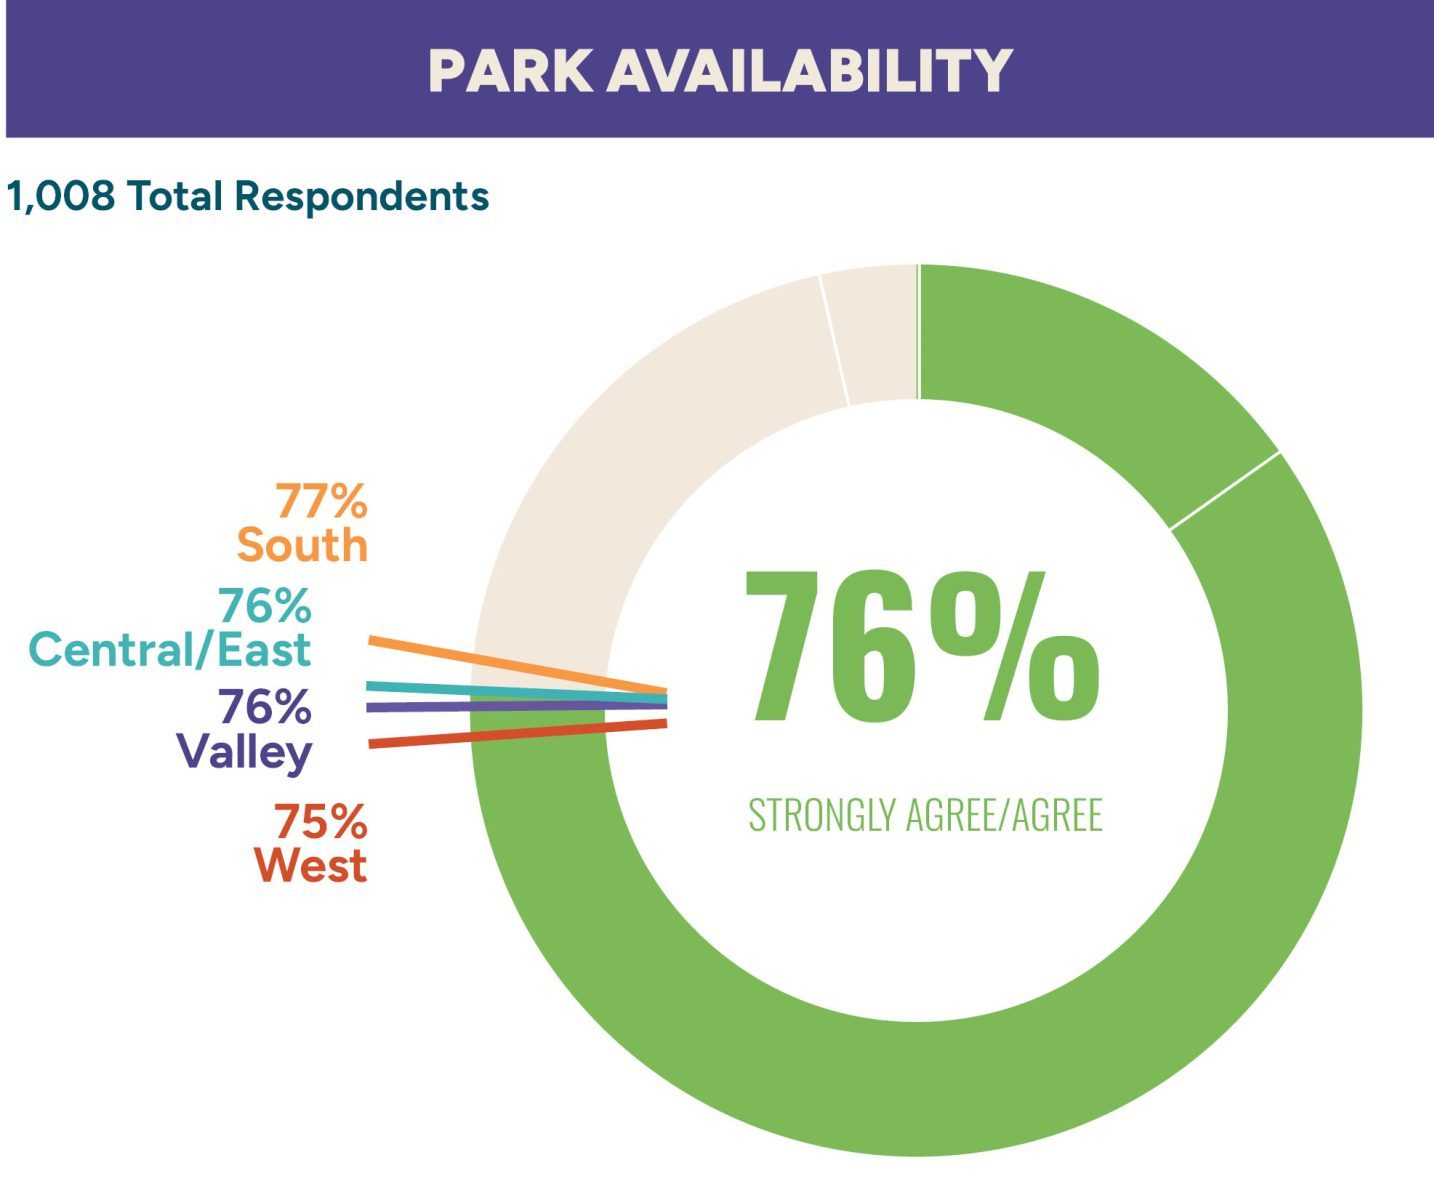
Each tick mark represents a different region. The percentage shown should be compared to the statistic shown in the middle of the pie chart.
Which households are more likely to agree?
Respondents from households with XXX and households with XXX are more likely to agree…
Which households are less likely to agree?
Respondents from households over XXX are less likely to agree…
Callouts show households types whose responses differed from the overall results by at least 3.1%.
Cross-tab information has a higher margin of error due to a smaller number of respondents.
Cross-Tabular Information
- Region
- Household Type
- Race/Ethnicity
- Annual Household Income
- Years in City
- Council District
Park Access
Access and Availability
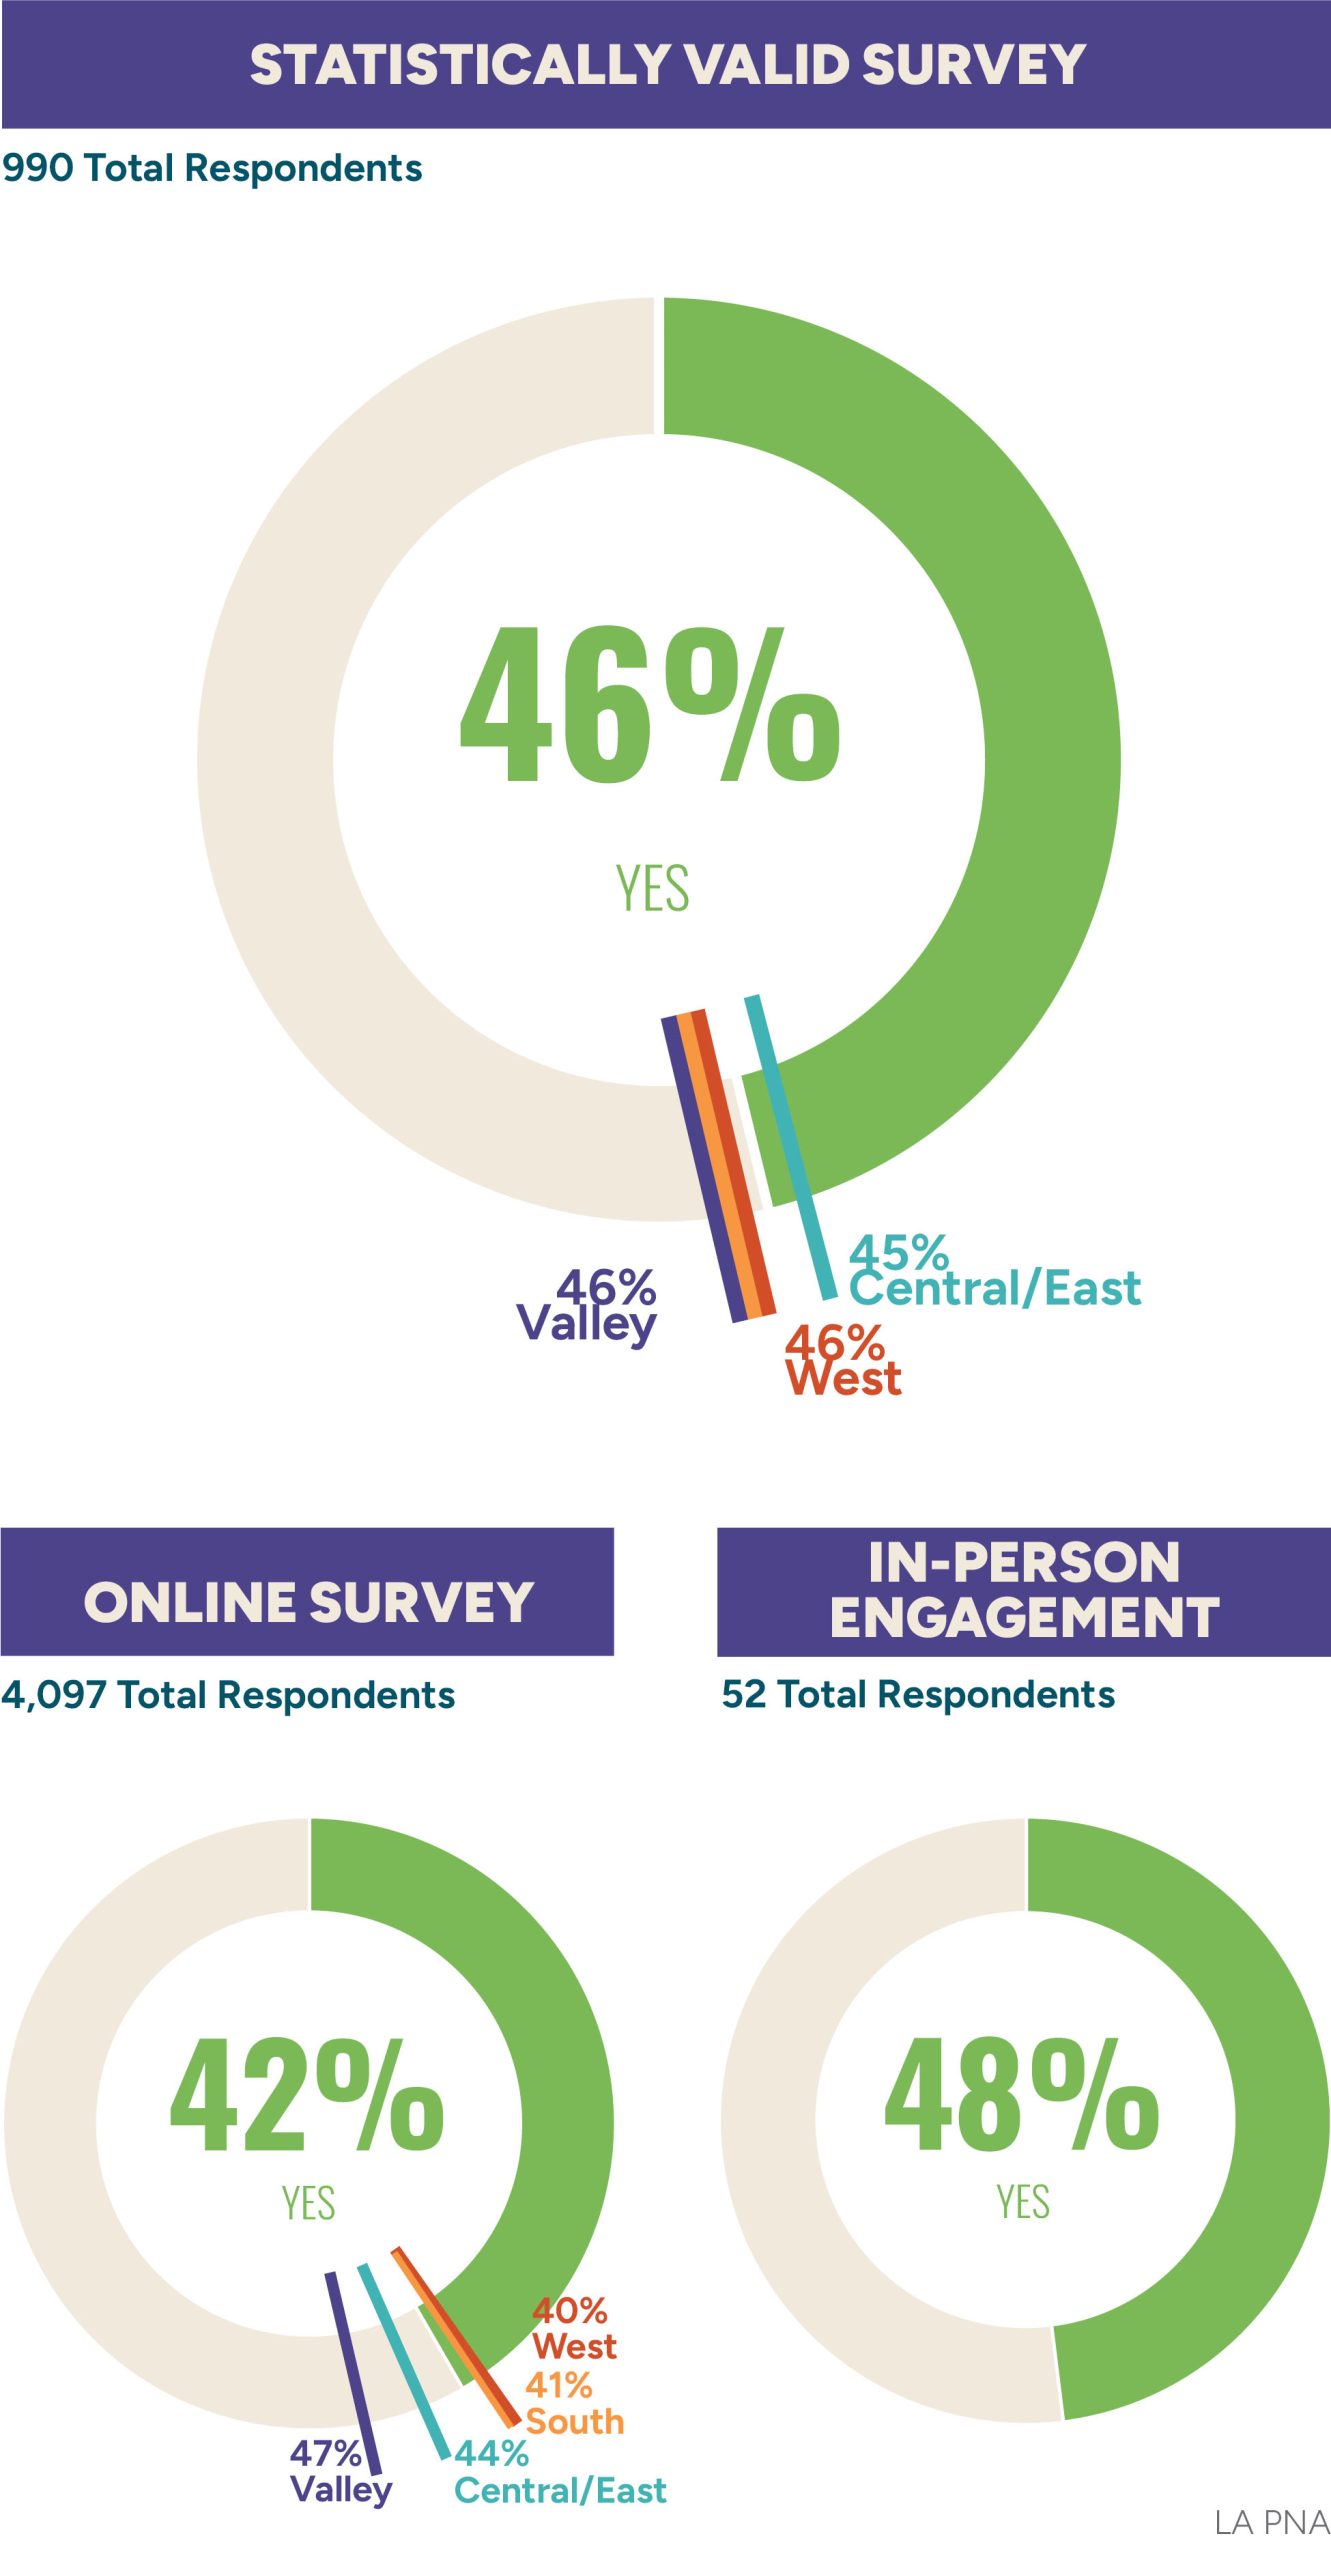
Less than half of respondents feel that there are enough parks and/or recreation centers within walking distance of their home. The majority of respondents typically drive or walk to parks and recreation centers, while less than a quarter bike or take transit. Most respondents have visited a City of LA park within the past year, while only about half have visited a City of LA recreation center.
Less than half of respondents feel that there are enough parks and/or recreation centers within walking distance of their home.
Do you feel there are enough parks and/or recreation centers within walking distance of your home?
Which households agree?
Respondents from households with older children aged 10–19 (50%) and households over age 55 and without children (50%) are more likely to agree there are sufficient parks and recreation centers within walking distance.
Which households are less likely to agree?
Respondents from households making $10K–$40K annually (39%) are less likely to agree that there are enough parks and recreation centers within walking distance.
Conditions: Parks
Overall Condition
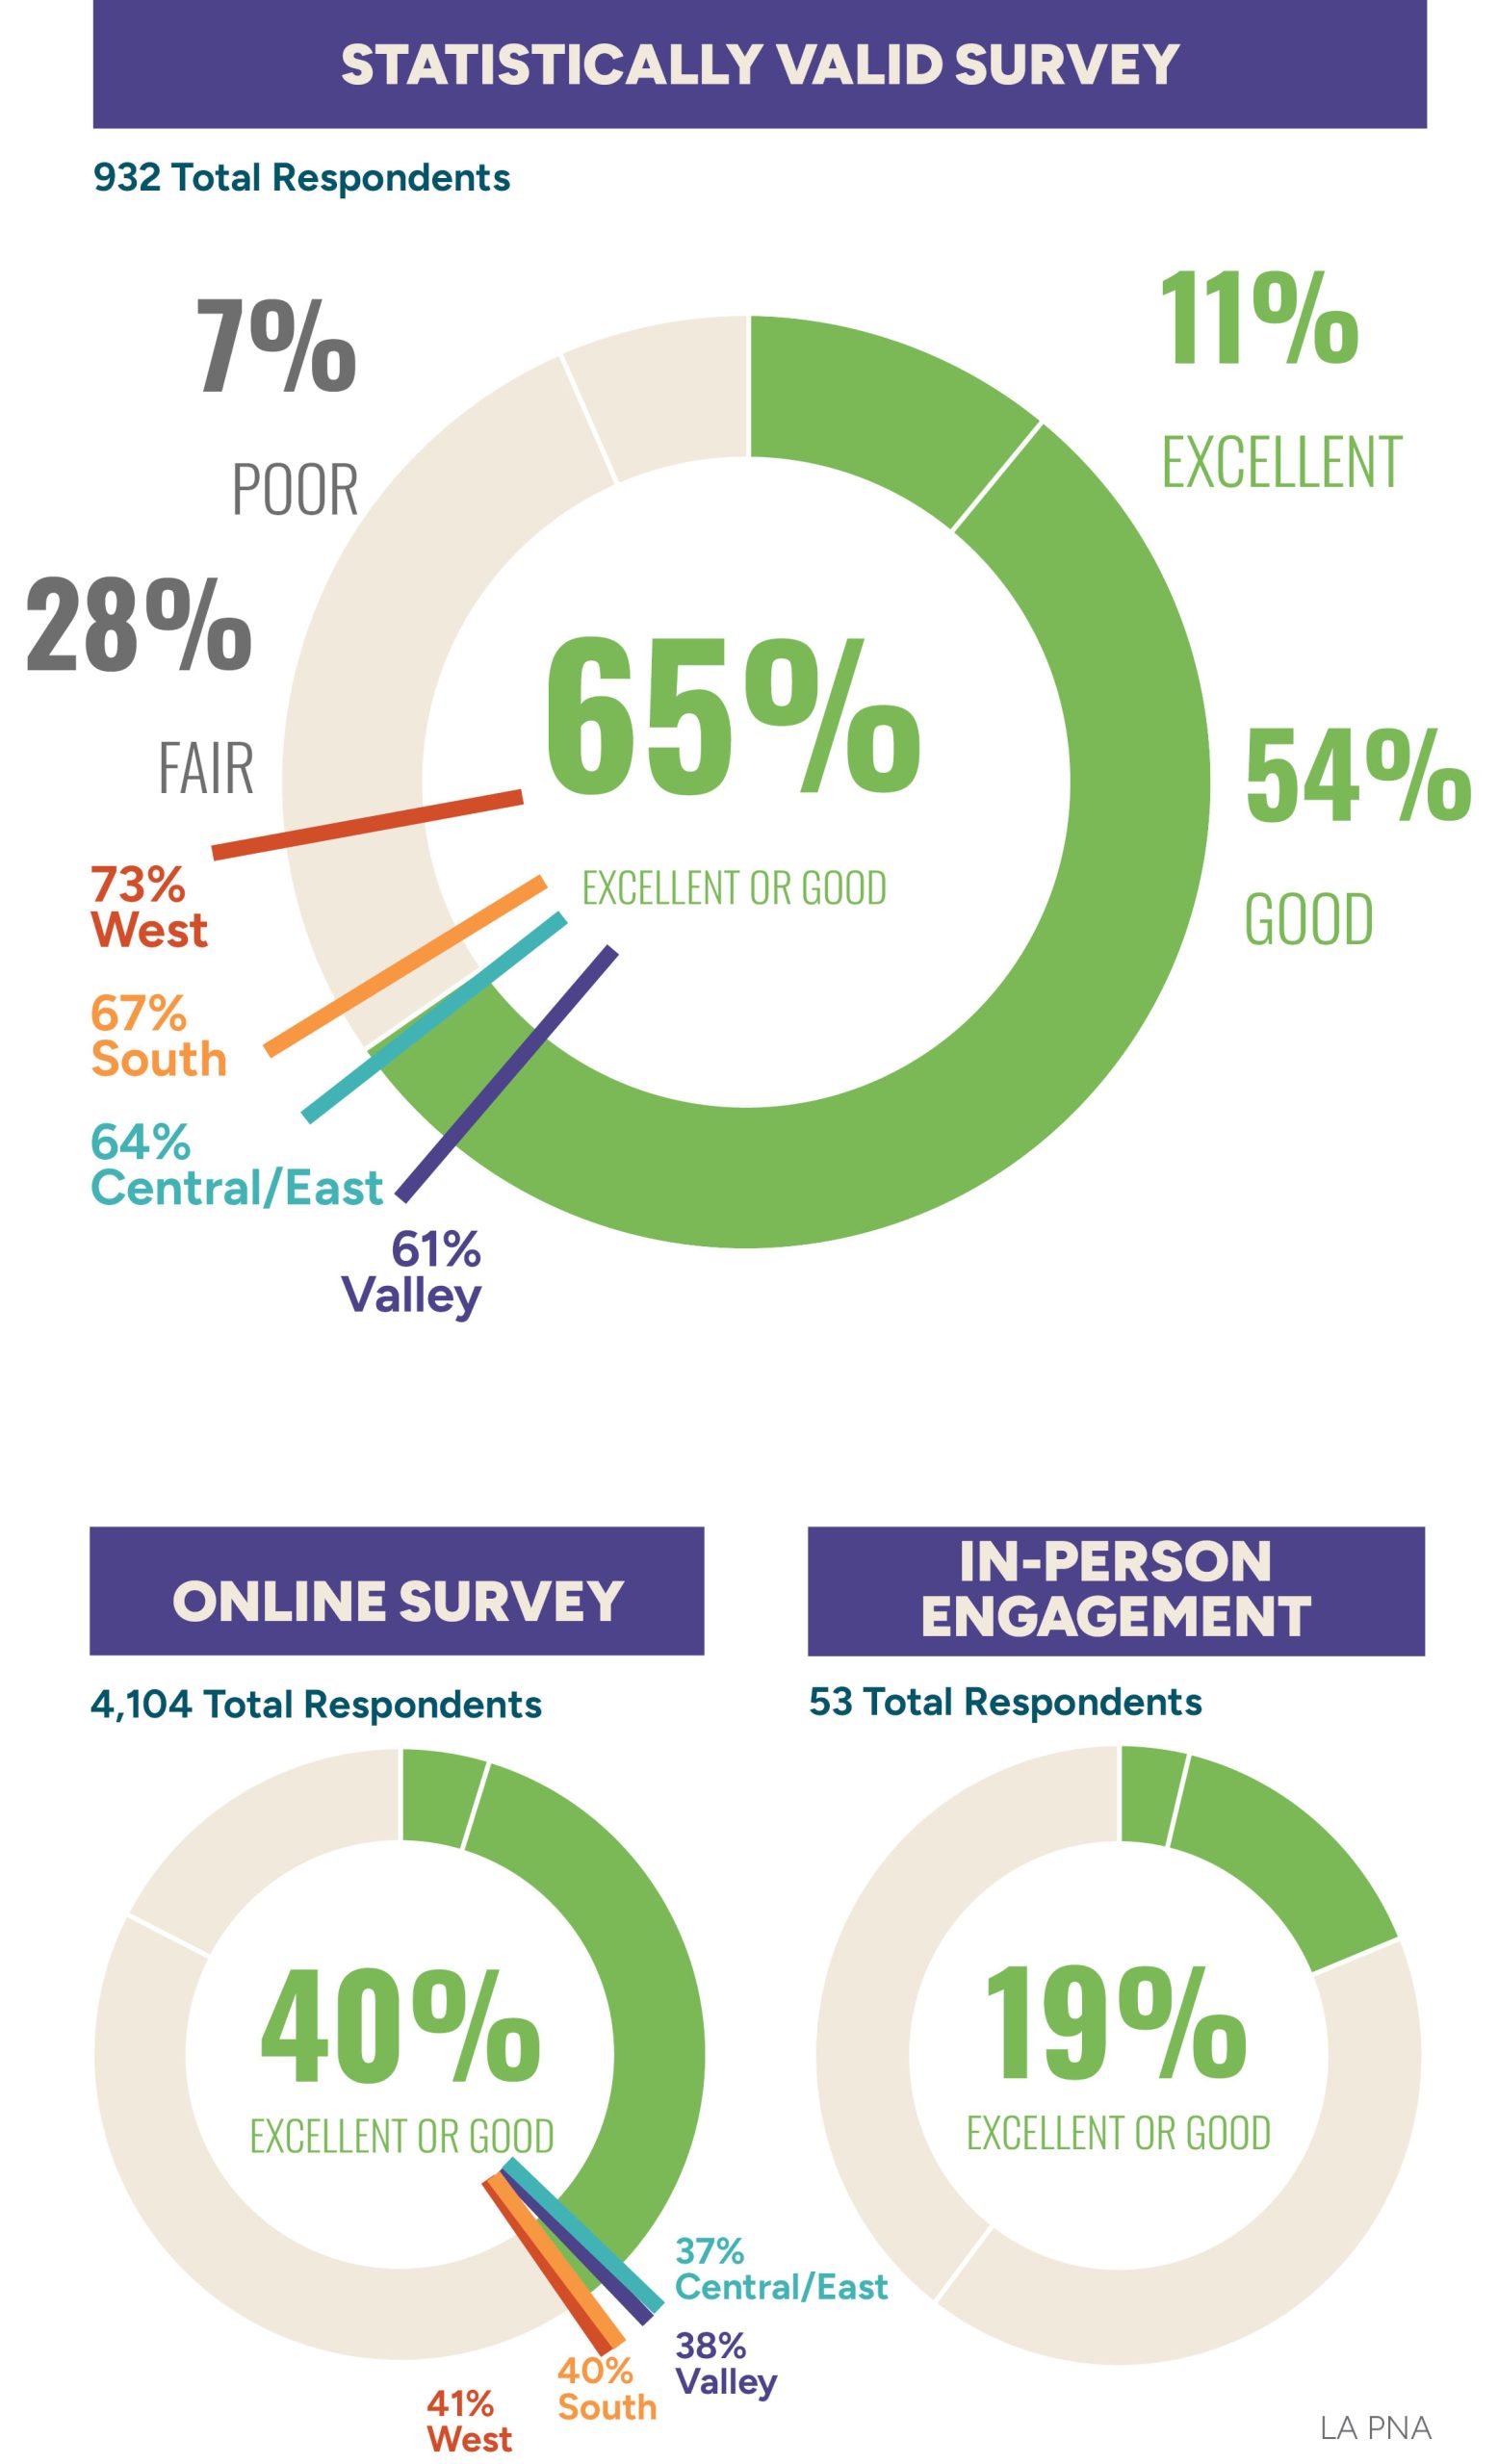
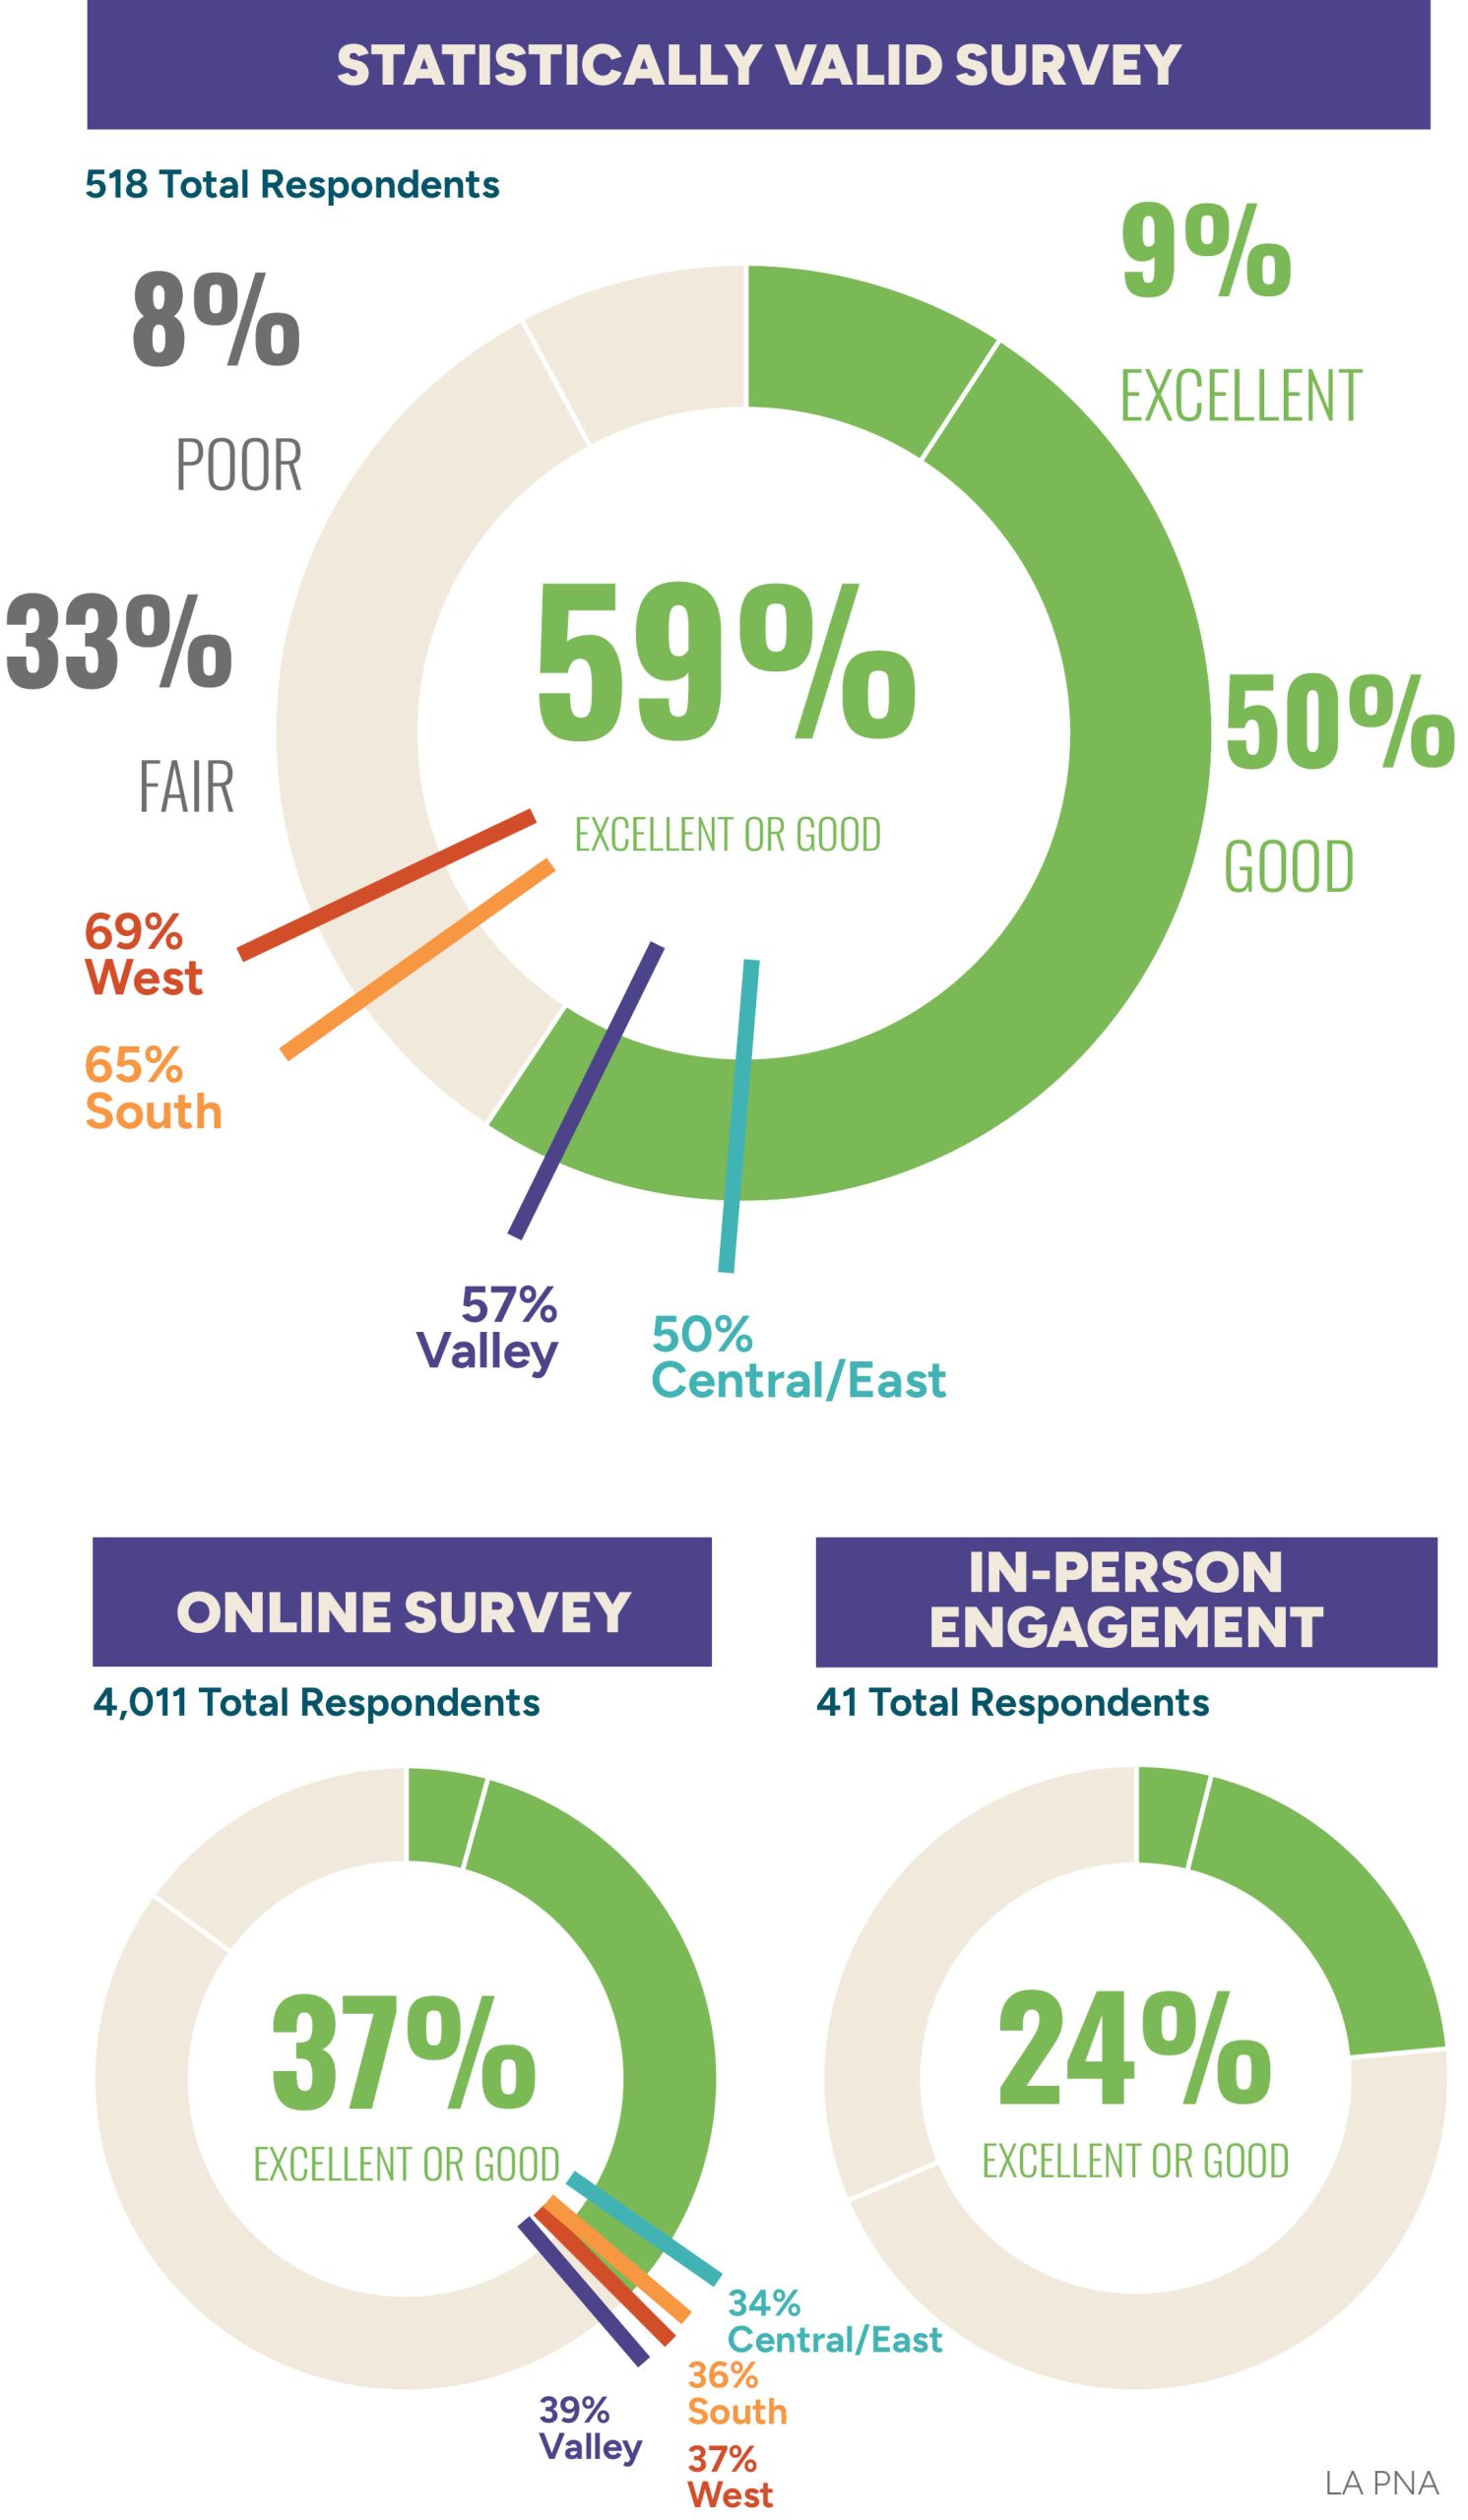
Respondents to the statistically valid survey were more positive about the physical condition of parks than respondents to the online survey and in-person meeting participants. Nearly two thirds of statistically valid survey respondents think parks are in excellent or good condition, compared with 40% for the online survey and 10% for in-person meeting participants.
Less than 40% of respondents think parks are in excellent or good condition.
How would you rate the physical condition of Los Angeles parks?
Which households agree?
Respondents from households who have lived in the City for 11–20 years (74%) agree that parks are in excellent or good condition.
Which households are less likely to agree?
Respondents from households who have lived in LA for more than 31 years (61%), households with older children aged 10–19 (61%), and households making more than $150K annually (59%) are less likely to agree that parks are in excellent or good condition.
Conditions: Recreation Centers
Overall Condition
Respondents to the statistically valid survey were more positive than those who responded online or in-person about the physical condition of recreation centers. While nearly two-thirds of statistically valid survey respondents think recreation centers are in excellent or good condition, only 37% of online respondents and 24% of in-person respondents agree.
Less than half of respondents think recreation centers are in excellent or good condition.
How would you rate the physical condition of Los Angeles recreation centers?
Which households agree?
Respondents from households who have lived in the City for less than 10 years (72%) agree that recreation centers are in excellent or good condition.
Which households are less likely to agree?
Respondents from households with young children aged under 10 (51%) and households making more than $150K annually (48%) are less likely to agree that recreation centers are in excellent or good condition.
Park Participation
Participation
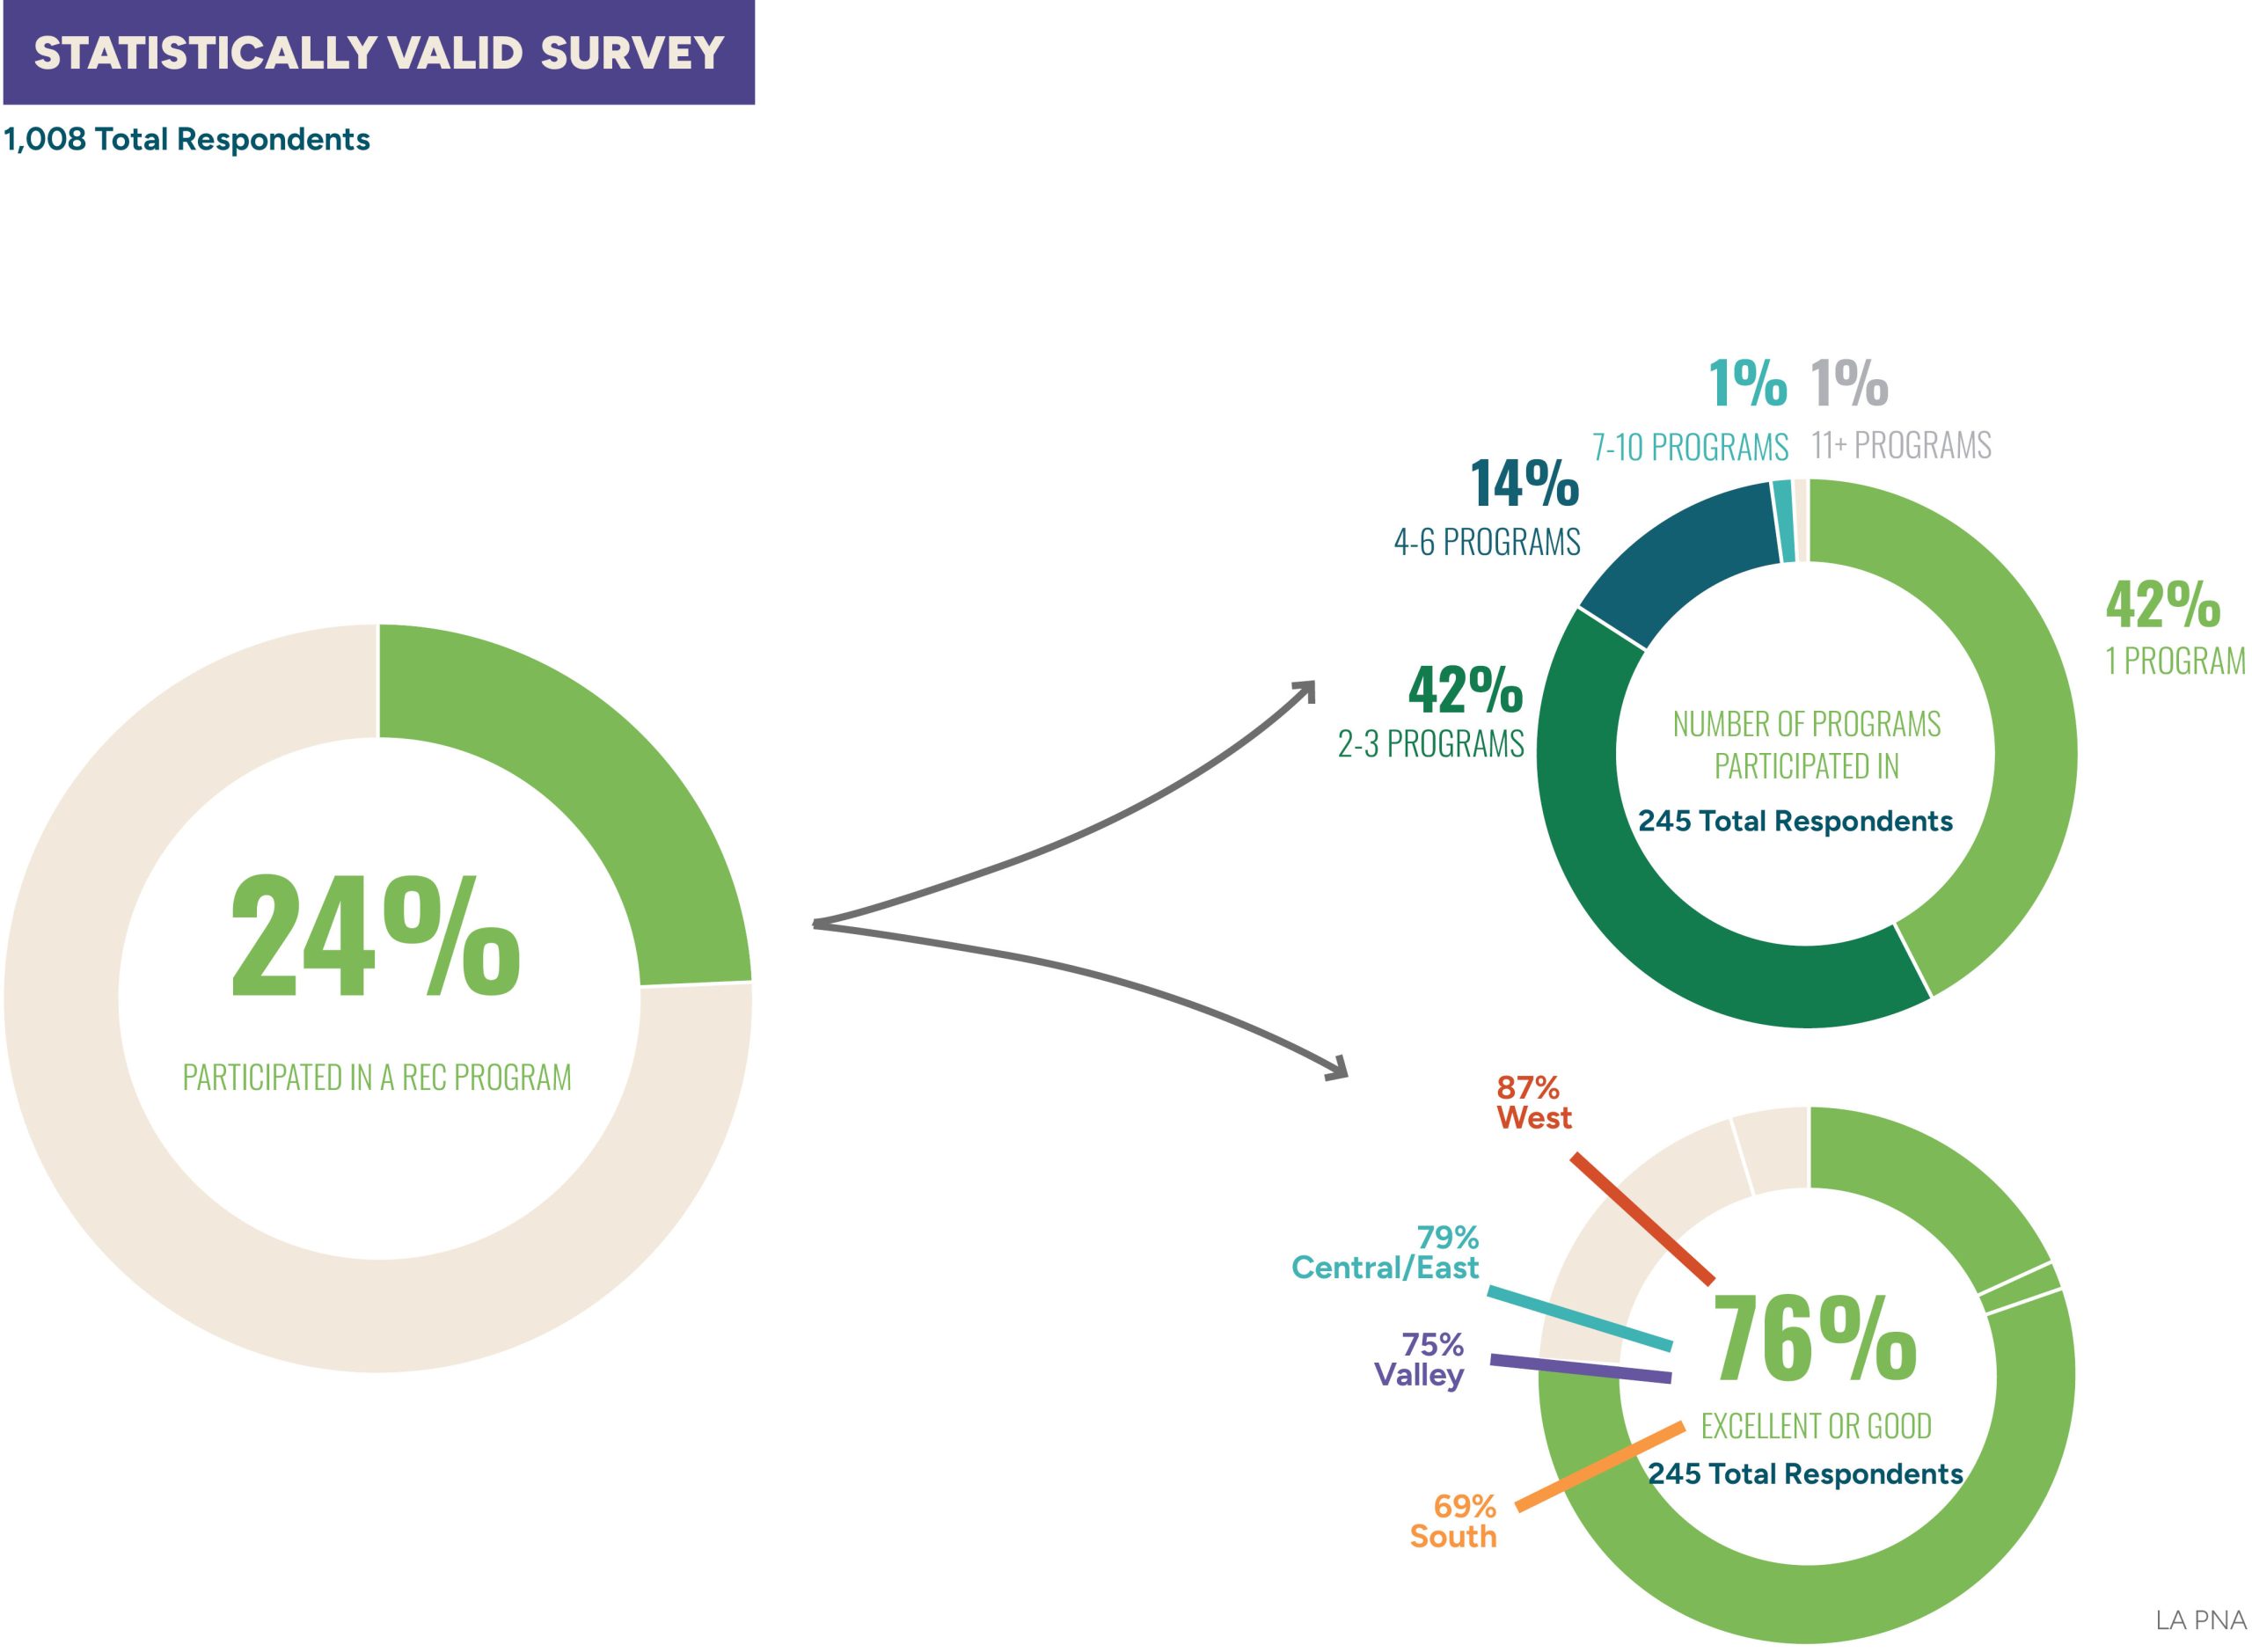
About one in four statistically valid survey respondents participated in a recreation program in the past year. Of those who participated, over 75% rated the quality of the recreation programs as excellent or good. And over 75% of respondents agree that recreation of park facilities are available when they want to use them.
Of those that participate in a recreation program, over 75% rated the quality of recreation programs as excellent or good.
How would you rate overall quality of all recreation programs your household members have participated in?
Park Visitation
Visitation
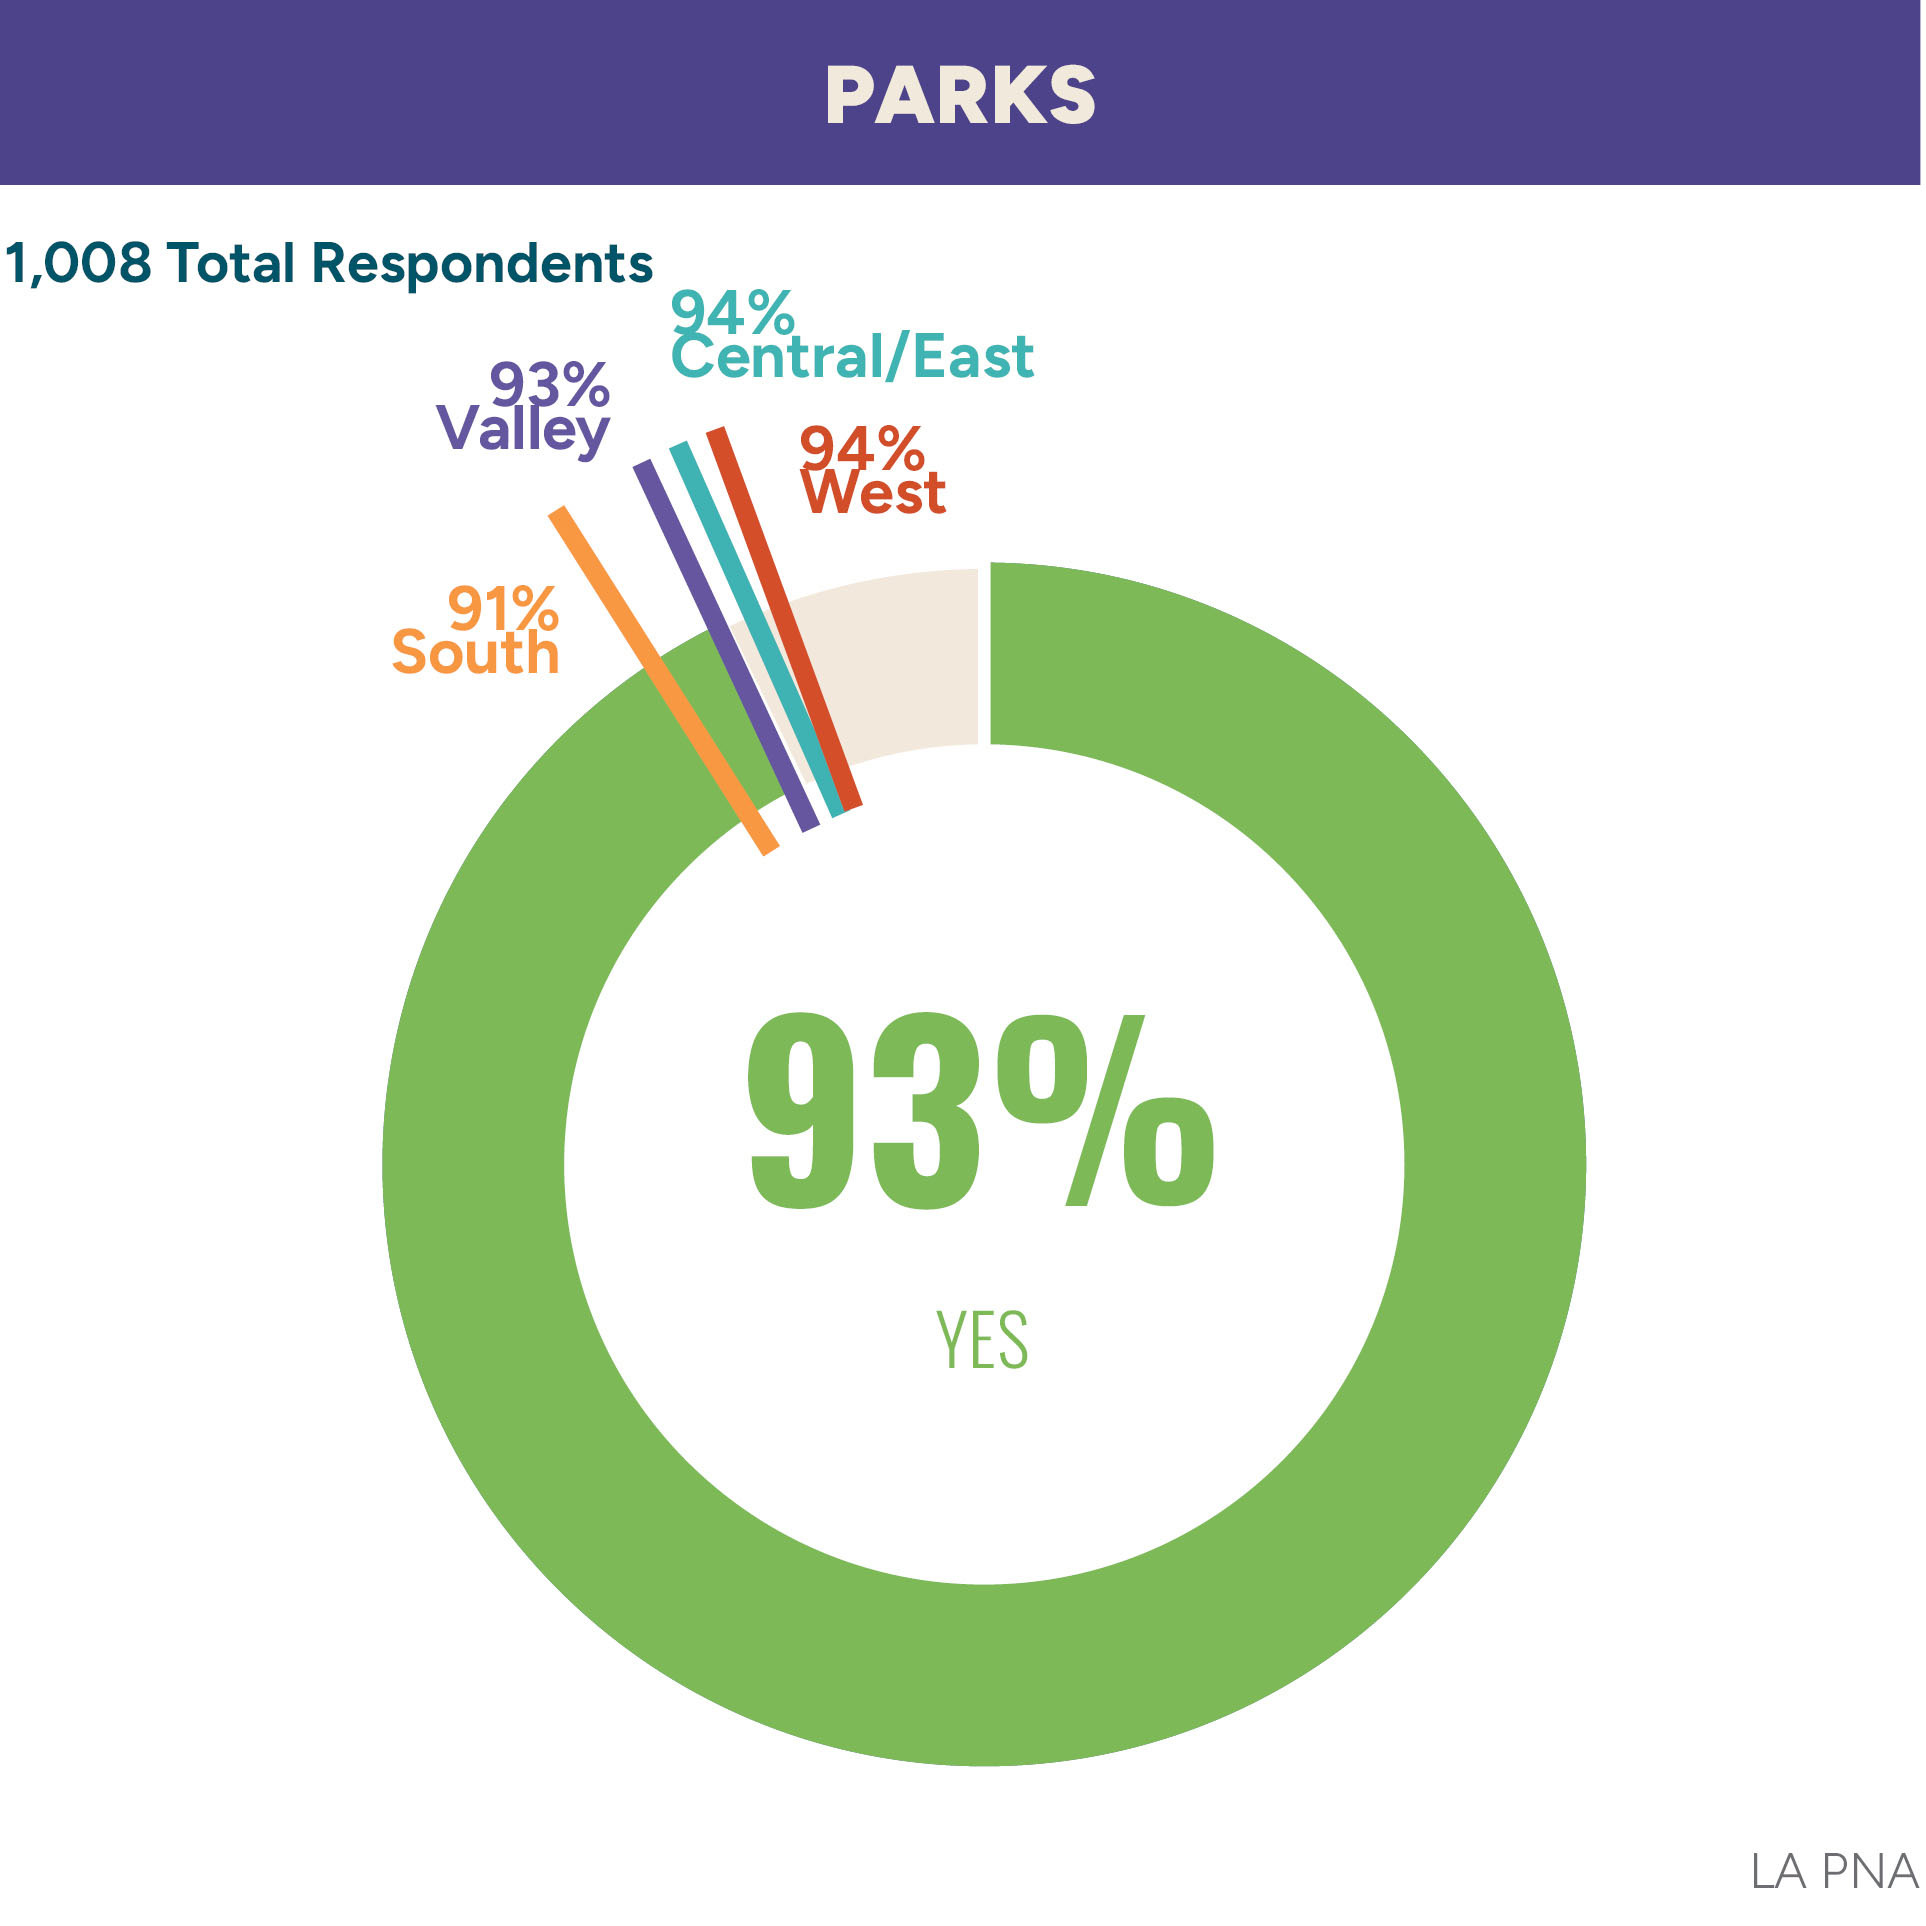
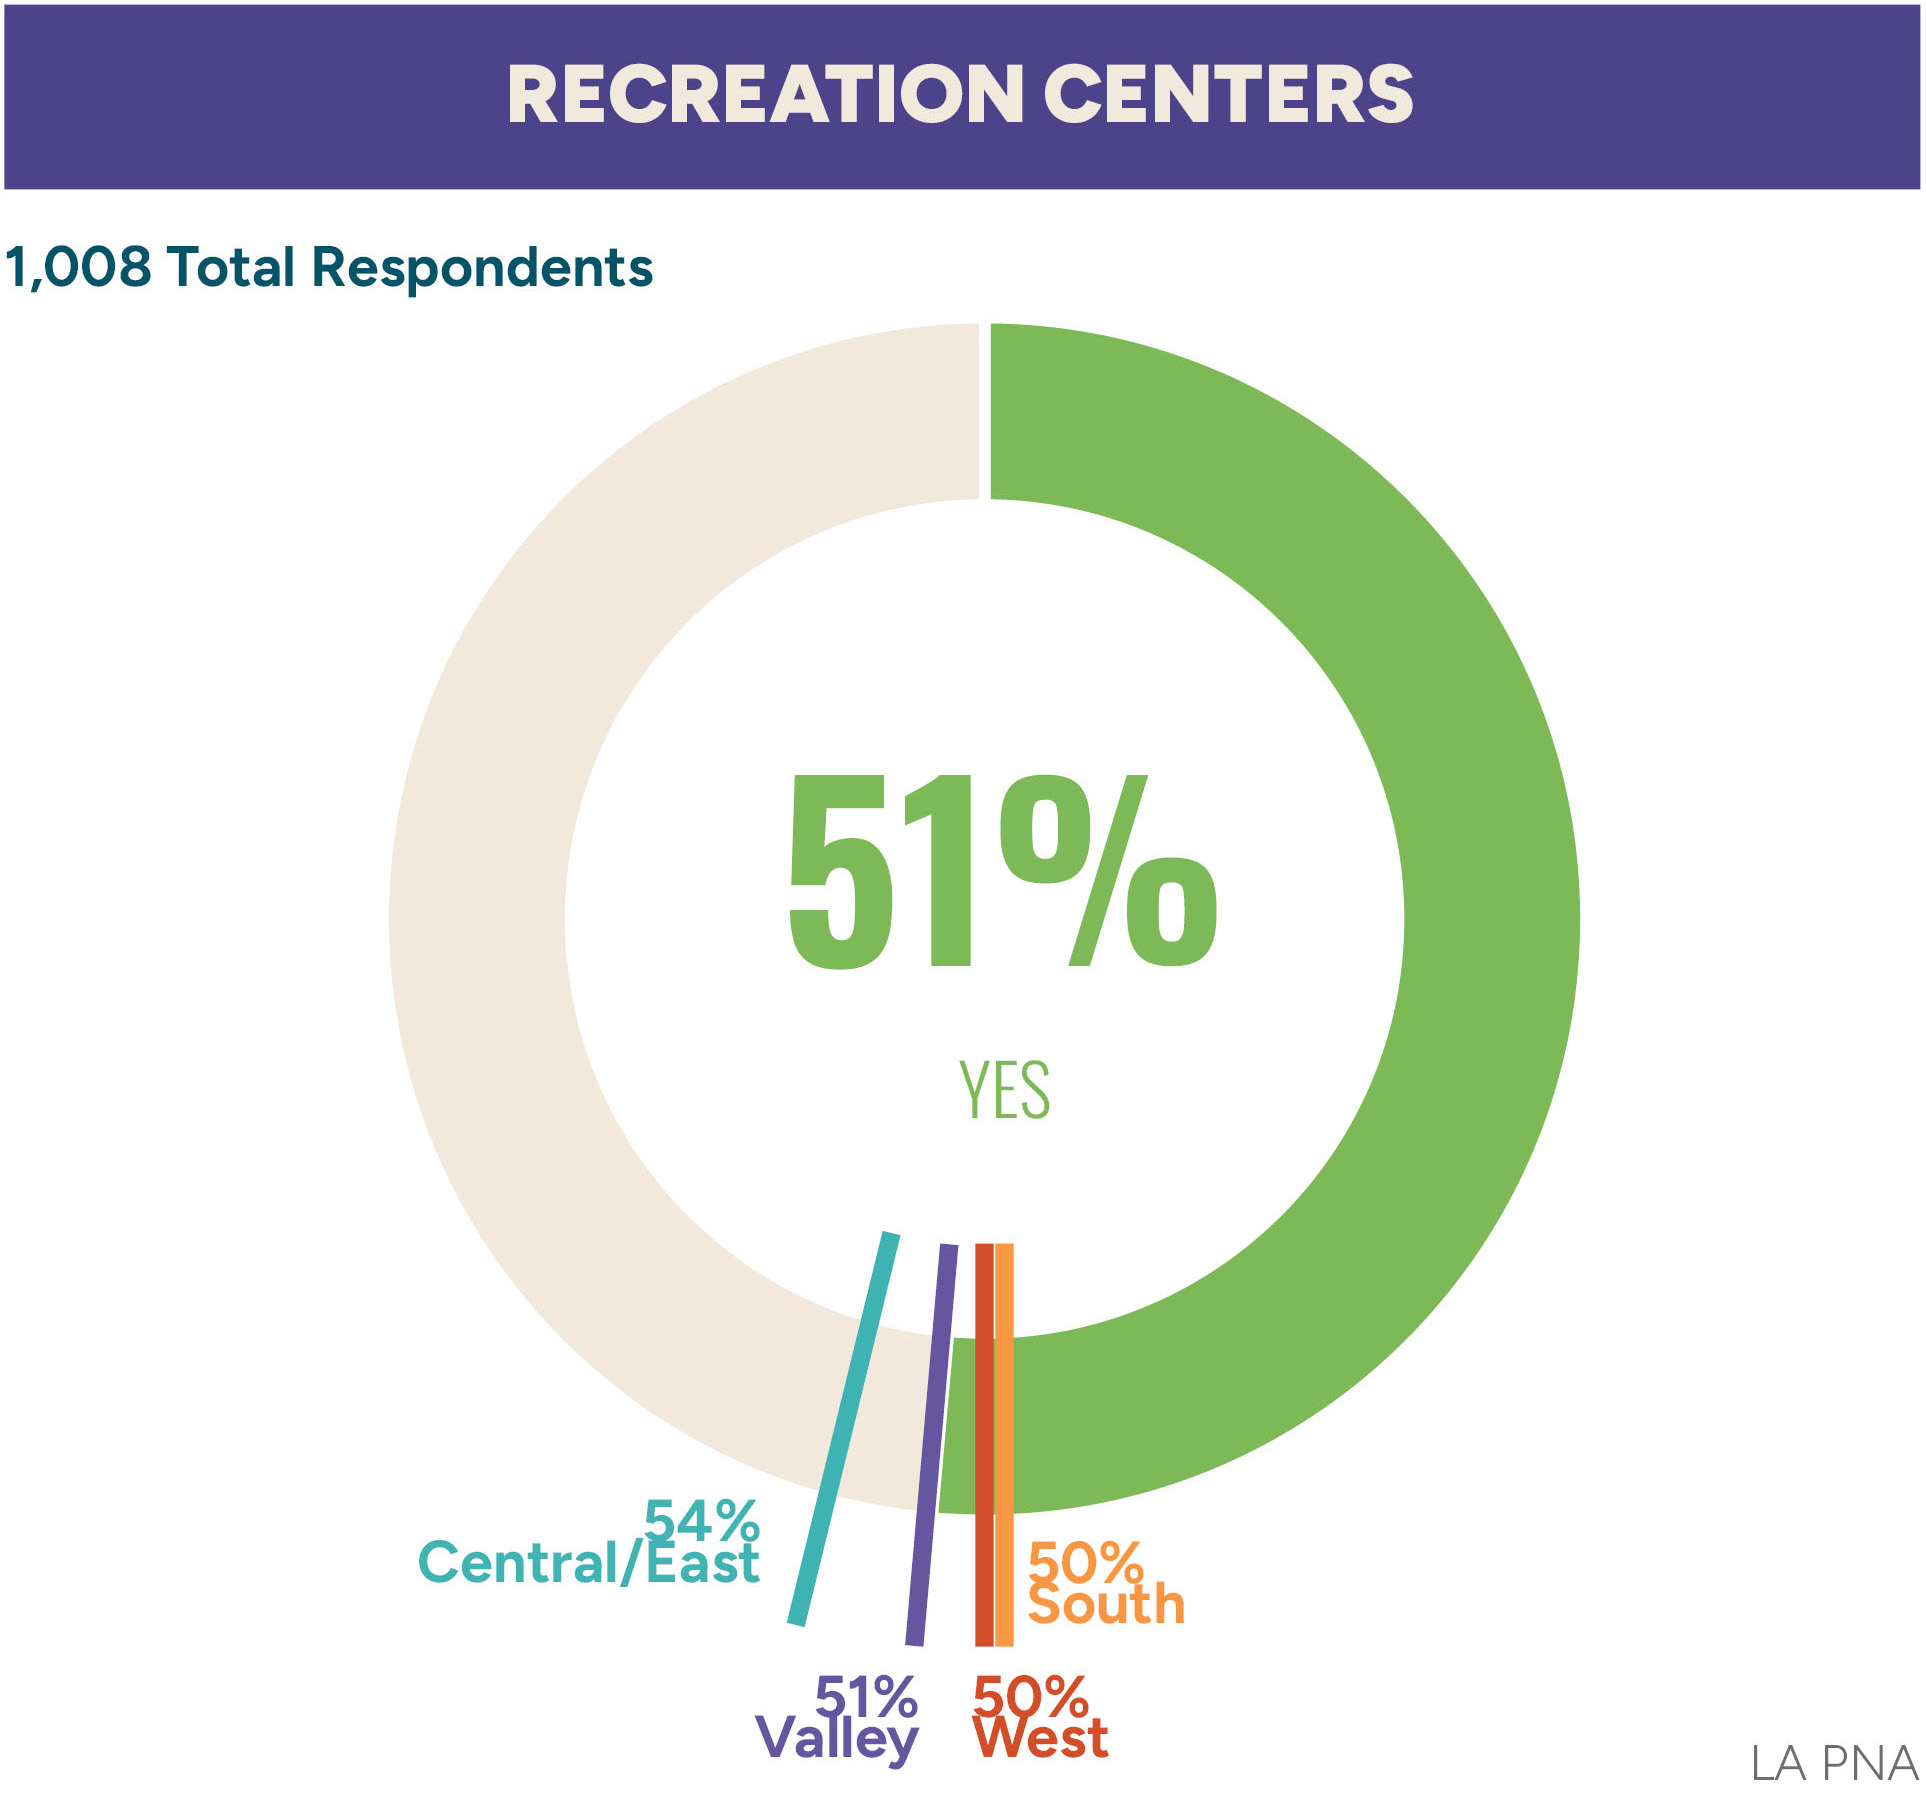
Visitation varies between parks and recreation centers. The majority of respondents have visited a park in the last year, while only half of respondents have visited a recreation center in the same time frame.
Most respondents have visited a City of LA park in the past year, while only about half have visited a City of LA recreation center.
Have you visited any parks and recreation centers offered by City Recreation & Parks in the past 12 months?
Which households agree?
Respondents from households with young children under 10 are more likely to have visited a park in the last year (97%).
Which households are less likely to agree?
Respondents from households making under $10K annually are less likely to have visited a park in the last year (13%).
Which households agree?
Respondents from households with young children aged under 10 (67%) and older children aged 10–19 (65%) are more likely to have visited a recreation center in the last year.
Which households are less likely to agree?
Respondents from Asian households (42%) and households who have lived in the City for less than 5 years (40%) are less likely to have visited a recreation center in the last year.
Park Availability
Availability
Respondents to the statistically valid survey generally agree that parks or recreation facilities are available when they want to use them, with more than three quarters of respondents strongly agreeing or agreeing.
More than 3/4 of respondents agree that recreation or park facilities are available when they want to use them.
Please rate your level of agreement with the following statement: Recreation or parks facilities are always available when I want to use them.
Which households agree?
Respondents from households with young children under 10 are more likely to have visited a park in the last year (97%).
Which households are less likely to agree?
Respondents from households making under $10K annually are less likely to have visited a park in the last year (13%).
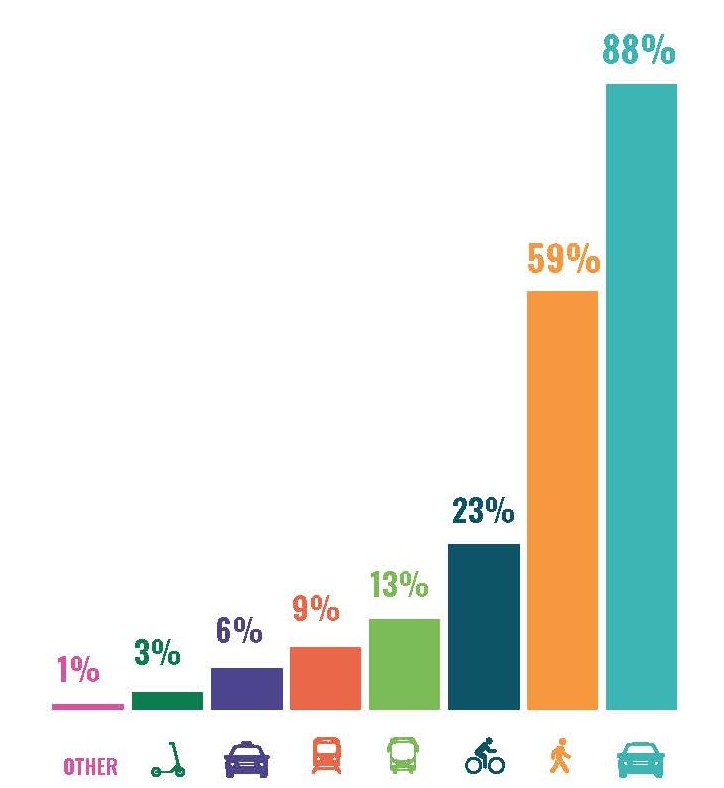
The majority of respondents typically drive or walk to parks and recreation centers.
Barriers to Visiting Parks
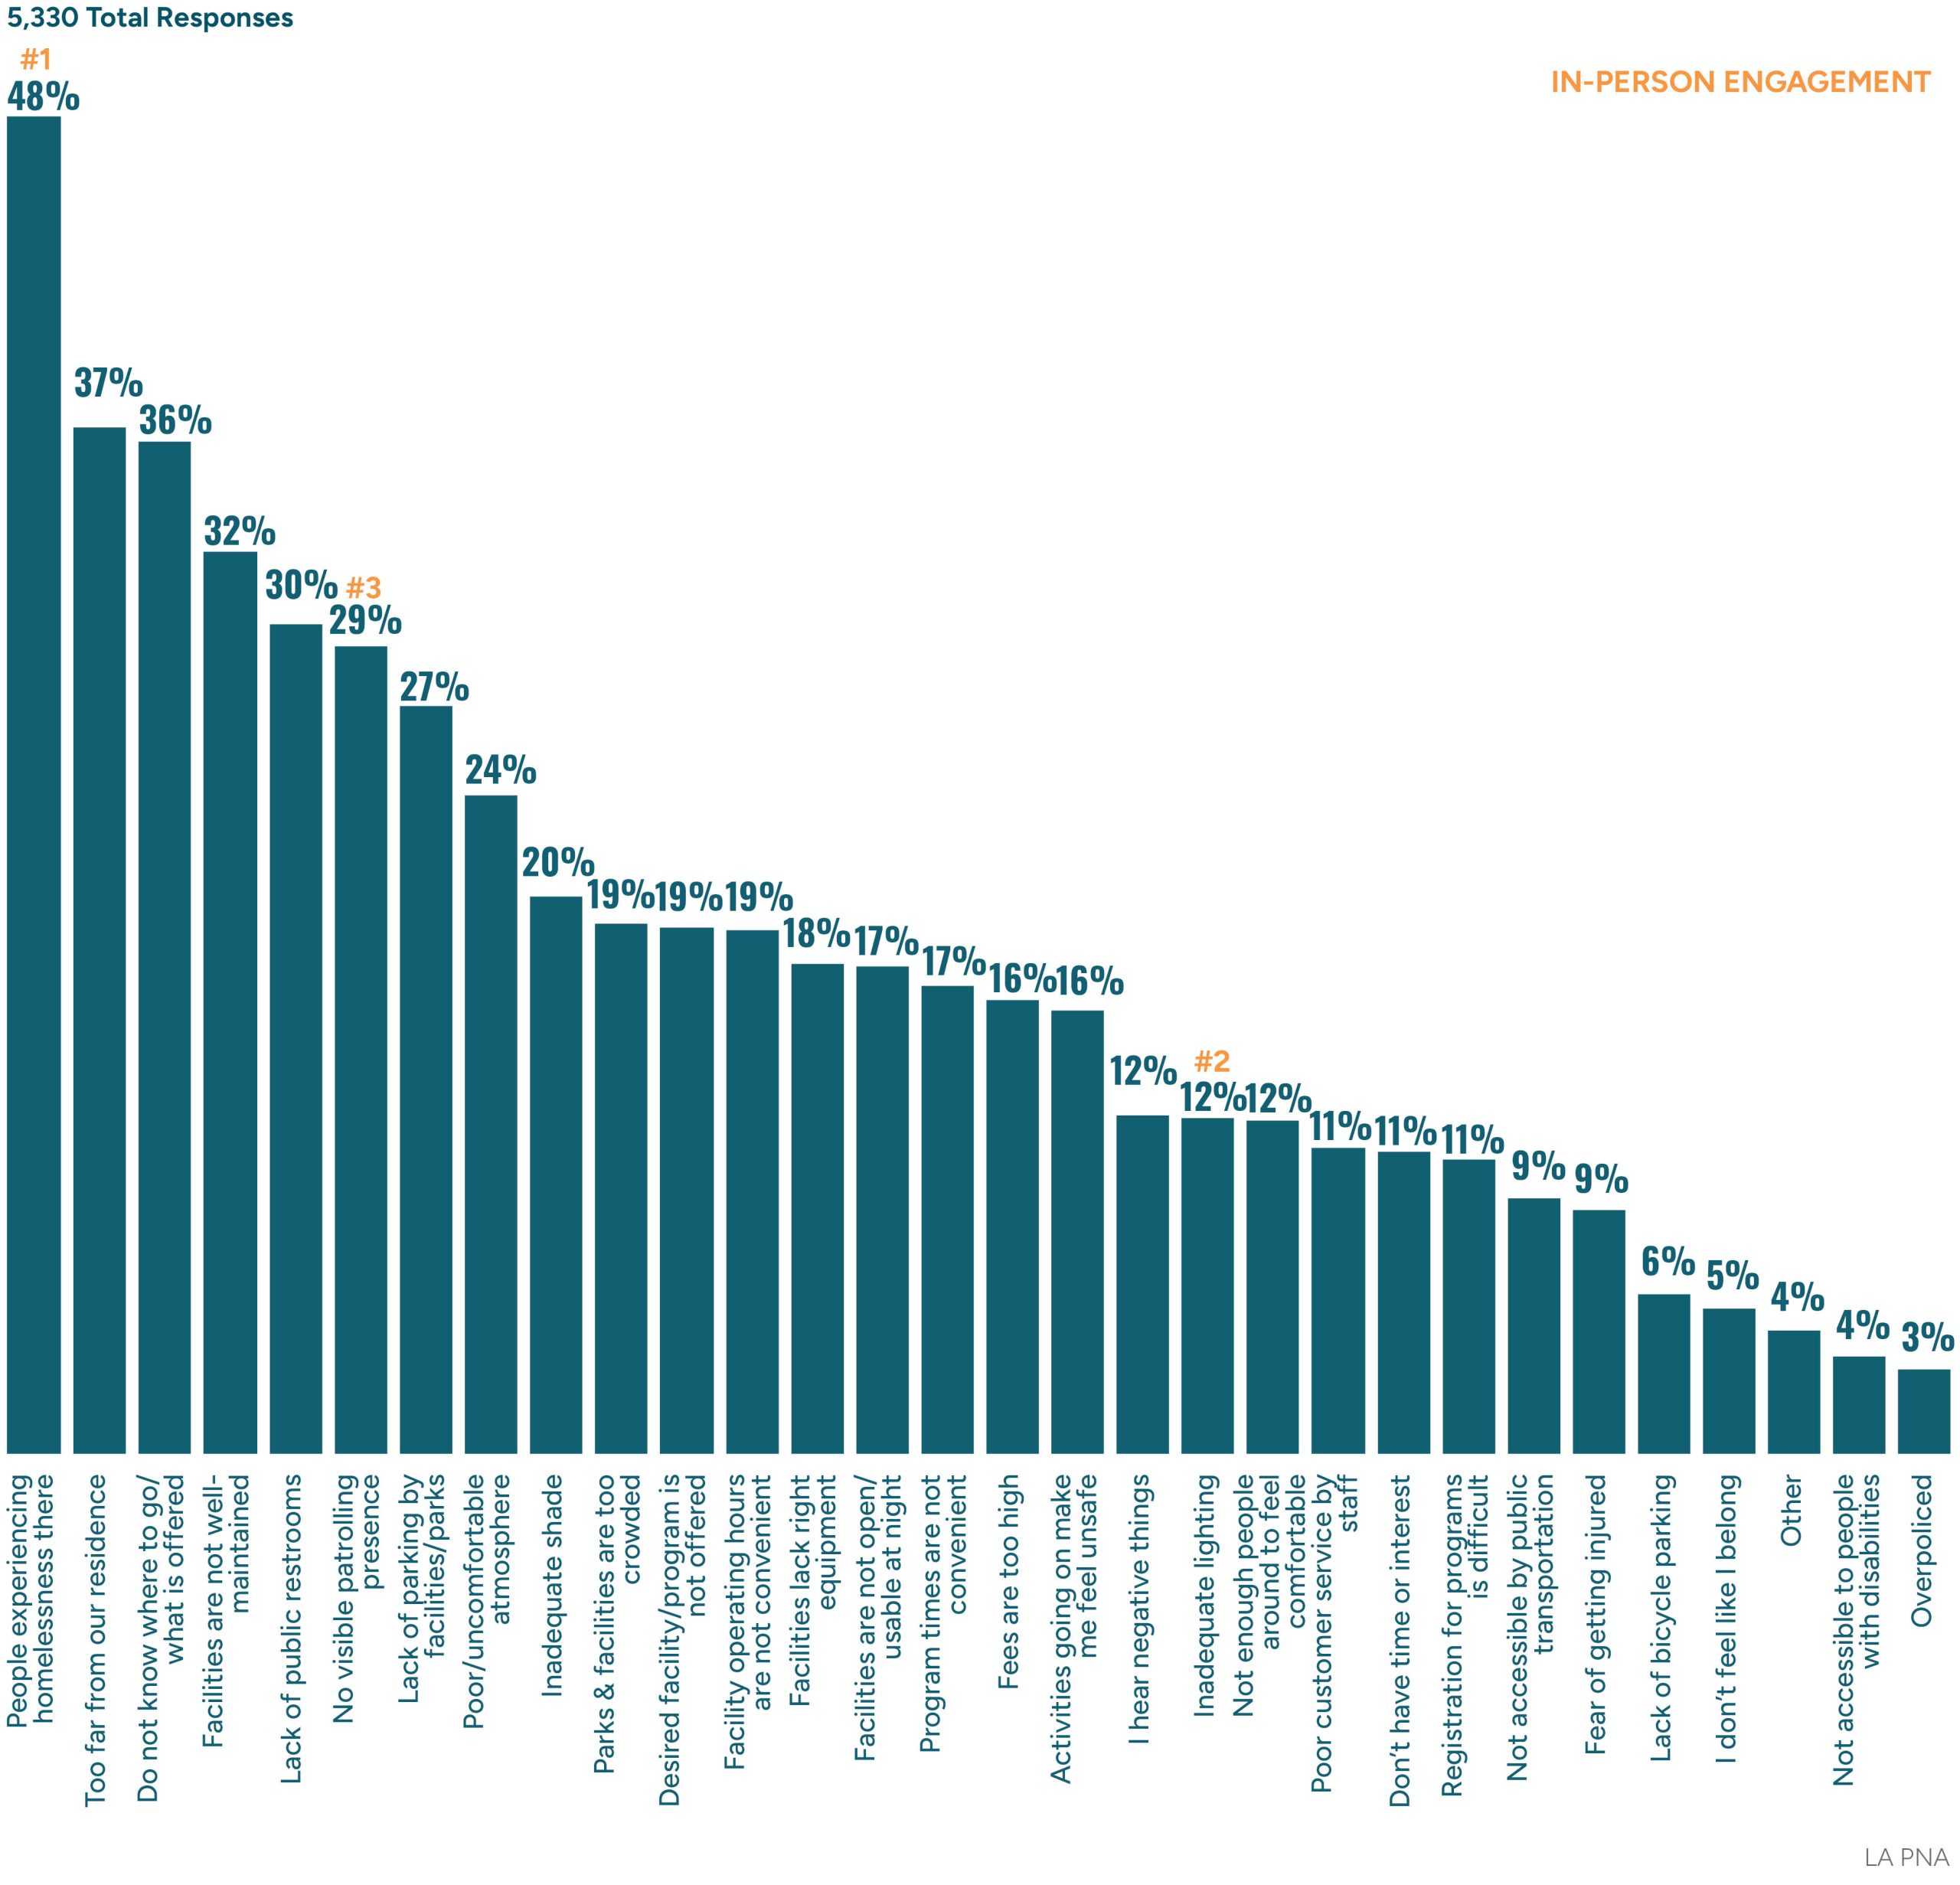
Barriers
The top barrier to visiting parks for respondents is people experiencing homelessness, with a little under half of respondents ranking it as their top reason. Other top barriers that prevent respondents from visiting parks include distance from residences, lack of information on where to go or what is offered at parks and recreation facilities, and lack of maintenance.
People experiencing homelessness is the most common reason respondents do not visit.
Please check all the reasons that prevent you or members of your household from visiting parks and recreation centers more often.
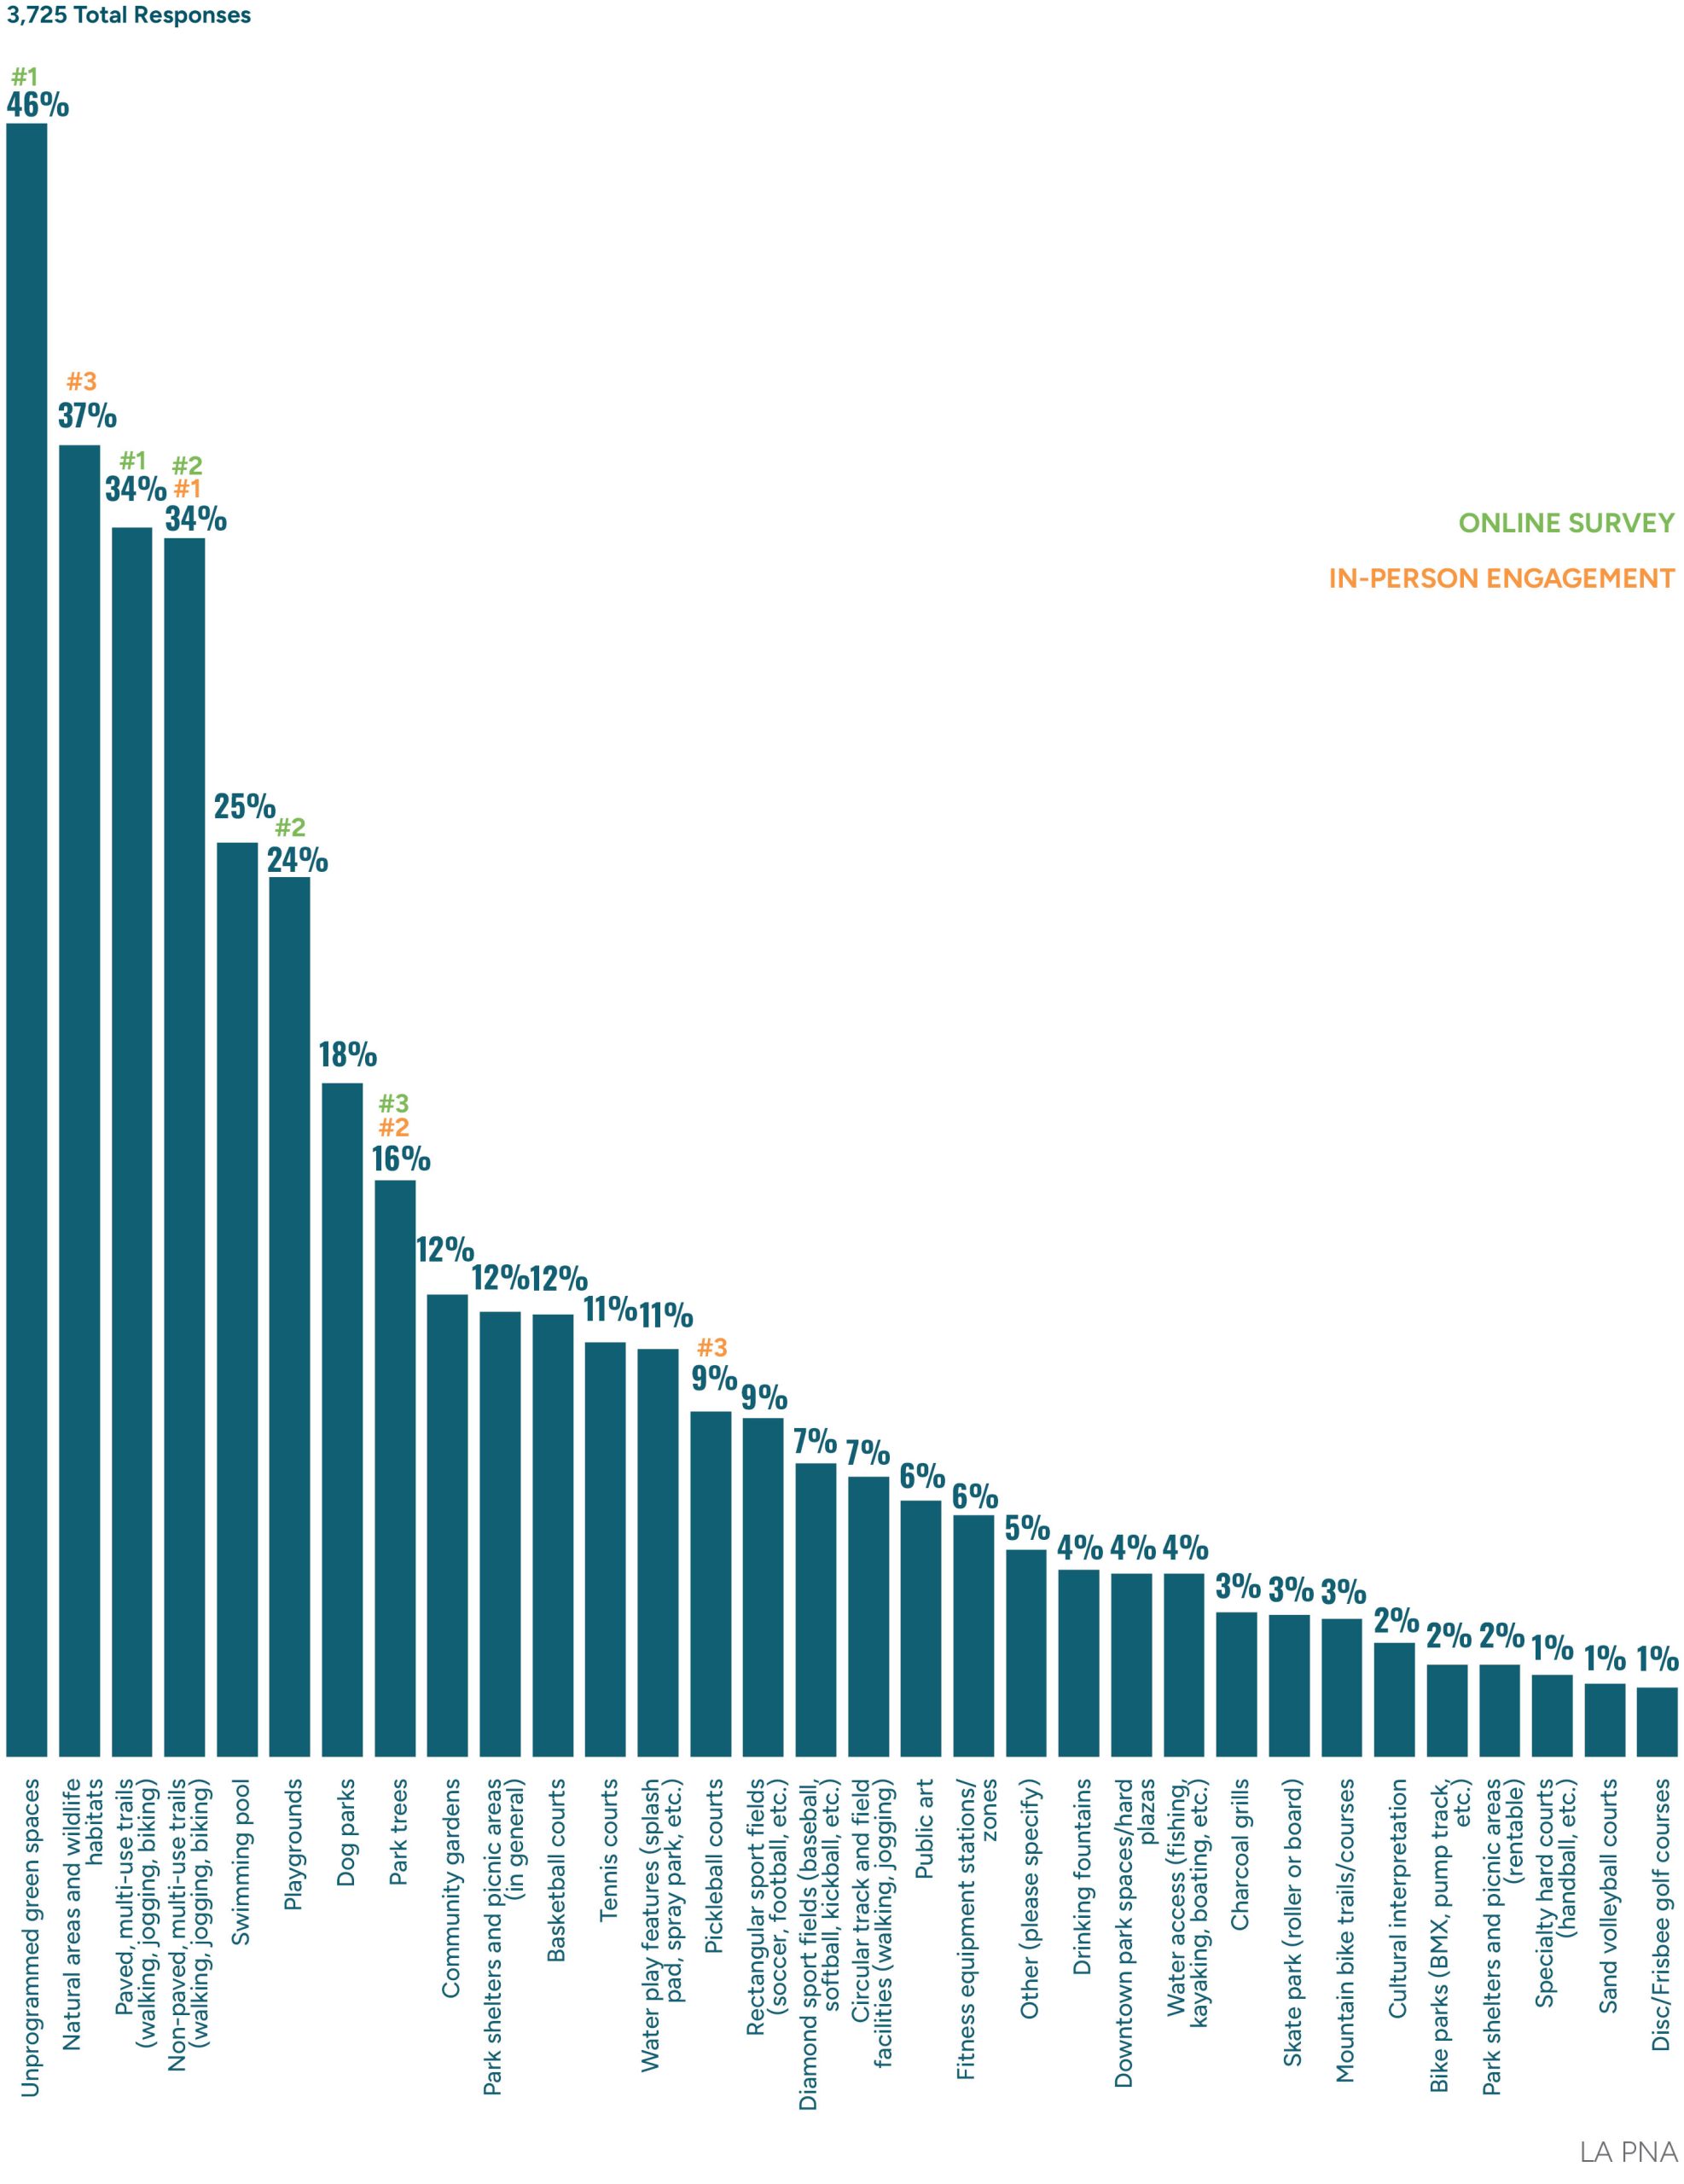
Most Important Outdoor Facilities
Which four of the outdoor facilities listed below are most important to you and the members of your household?
Unprogrammed green spaces, natural areas, and multi-use trails (paved and non-paved) are the most important outdoor facilities to respondents.
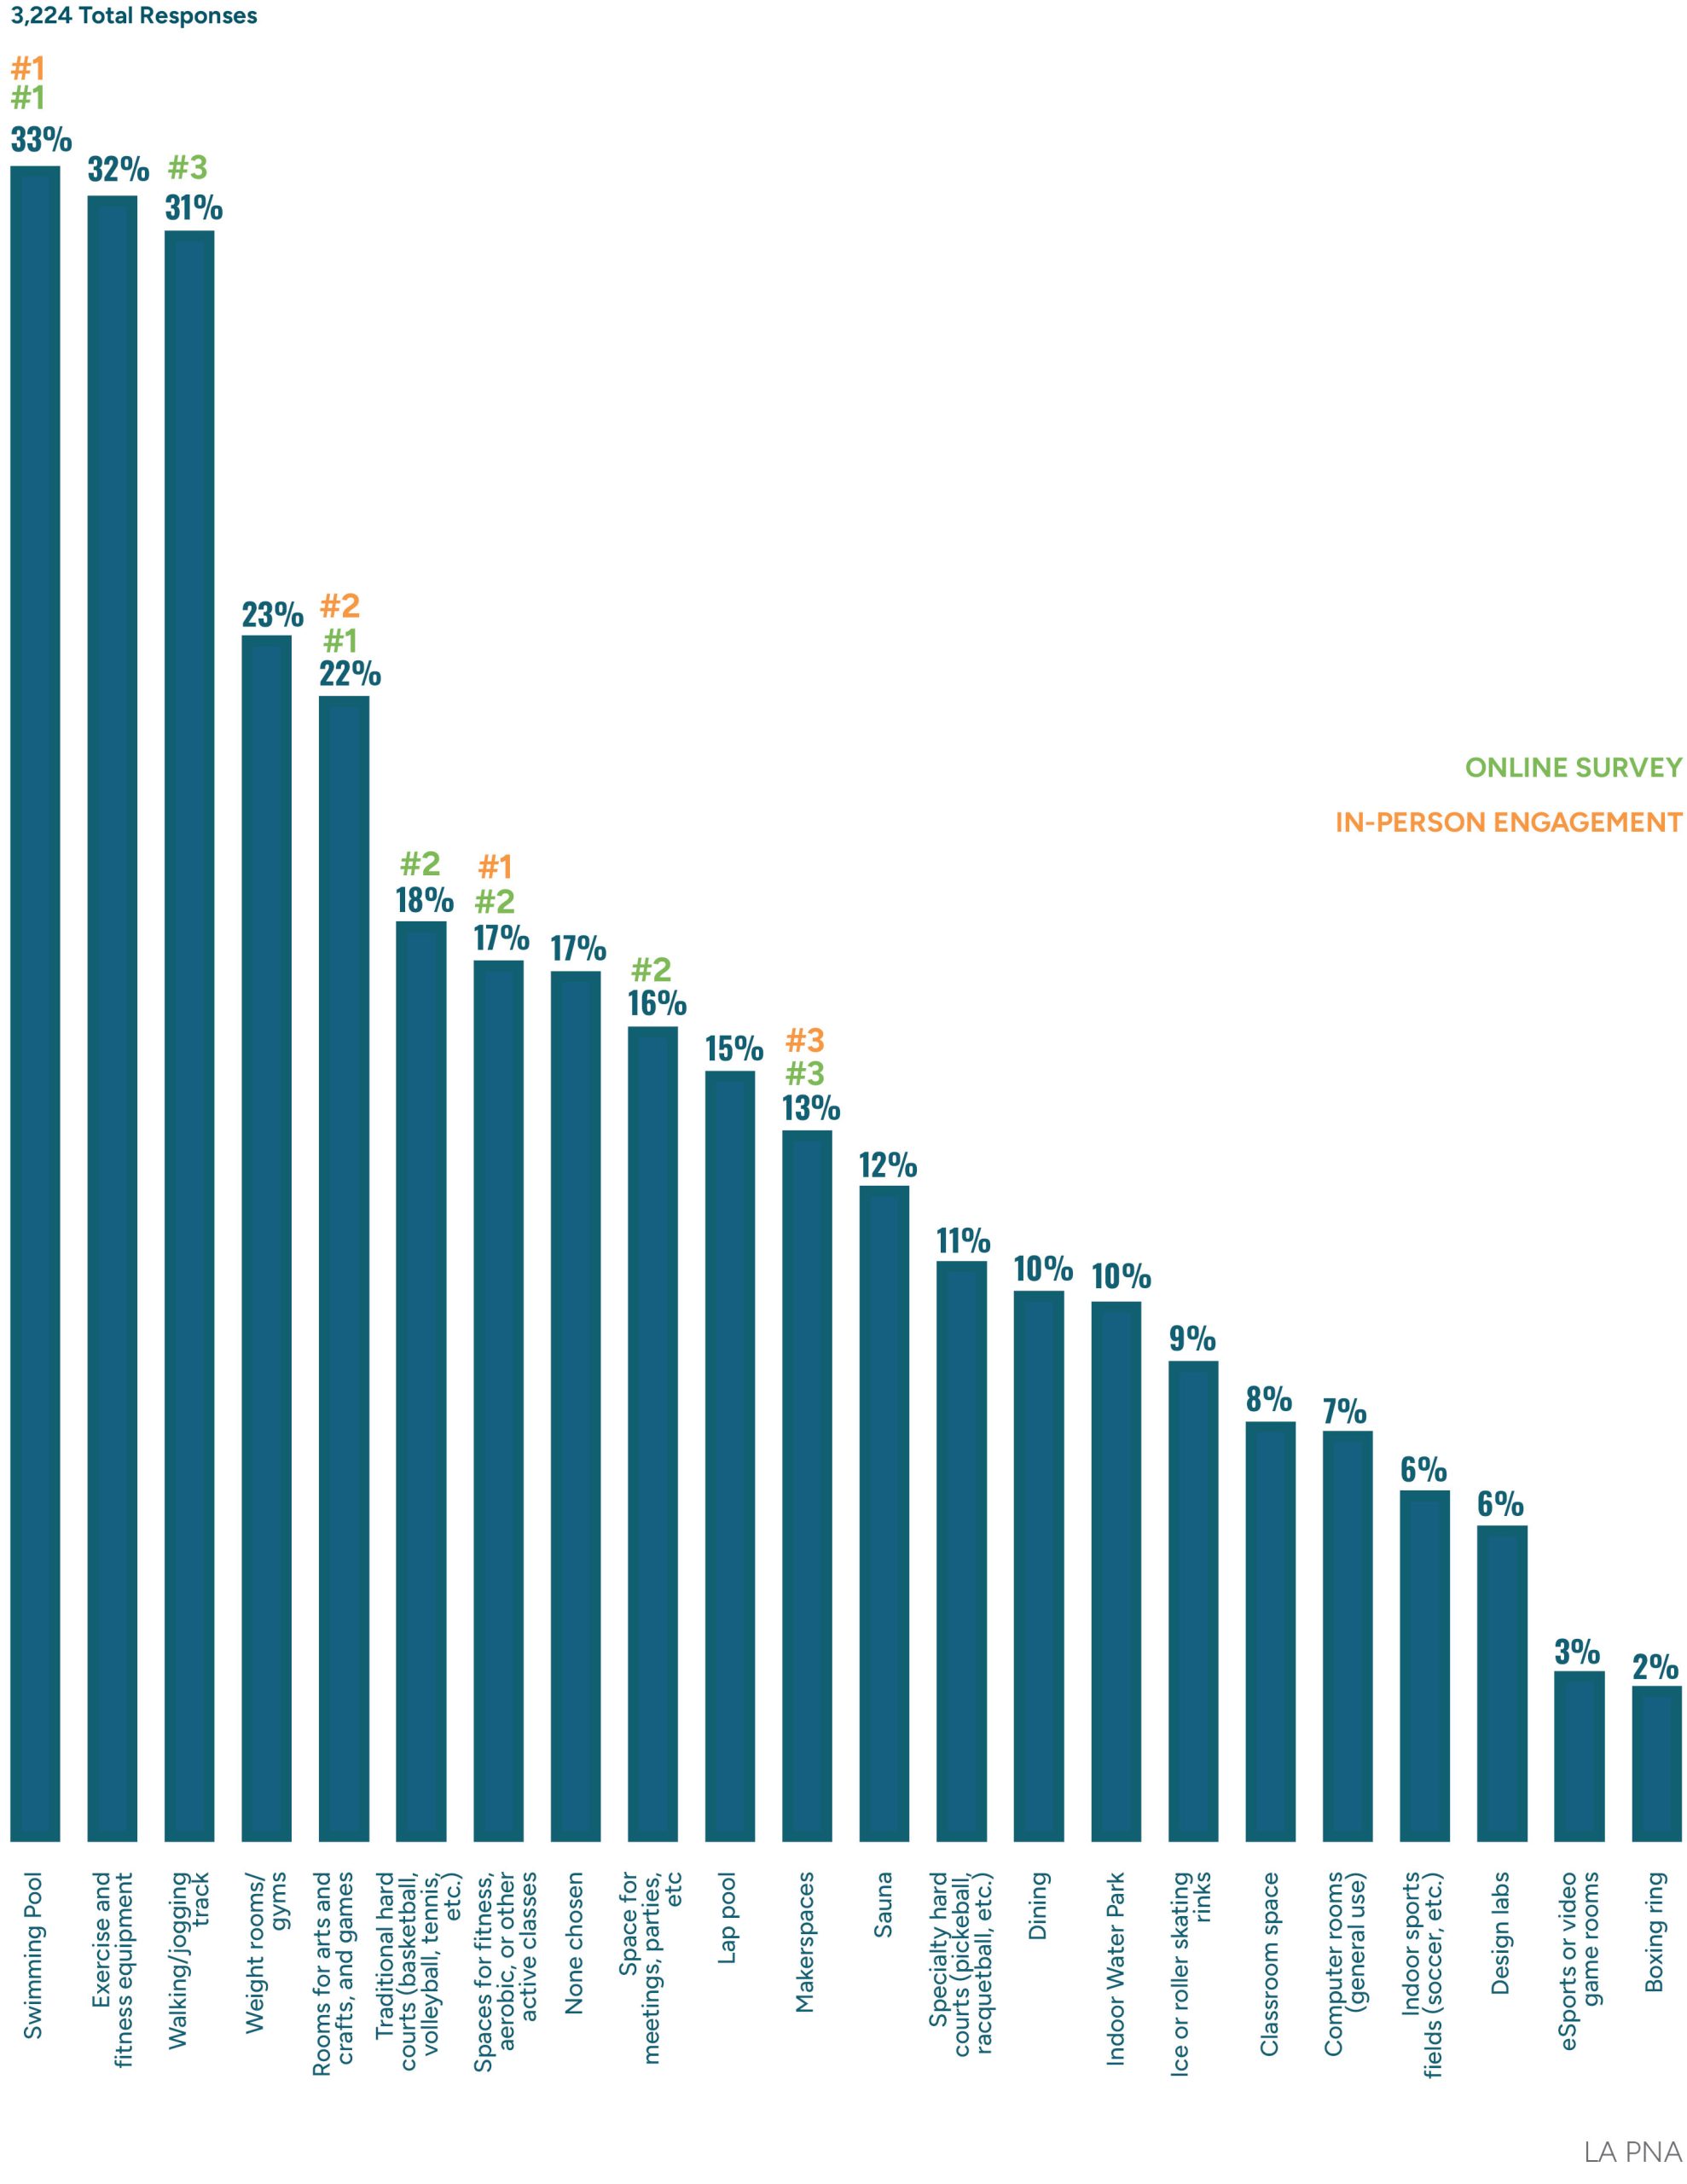
Most Important Indoor Facilities
Which four of the indoor facilities listed below are most important to you and the members of your household?
Swimming pools, exercise and fitness equipment, and walking tracks are the most important indoor facilities to respondents.
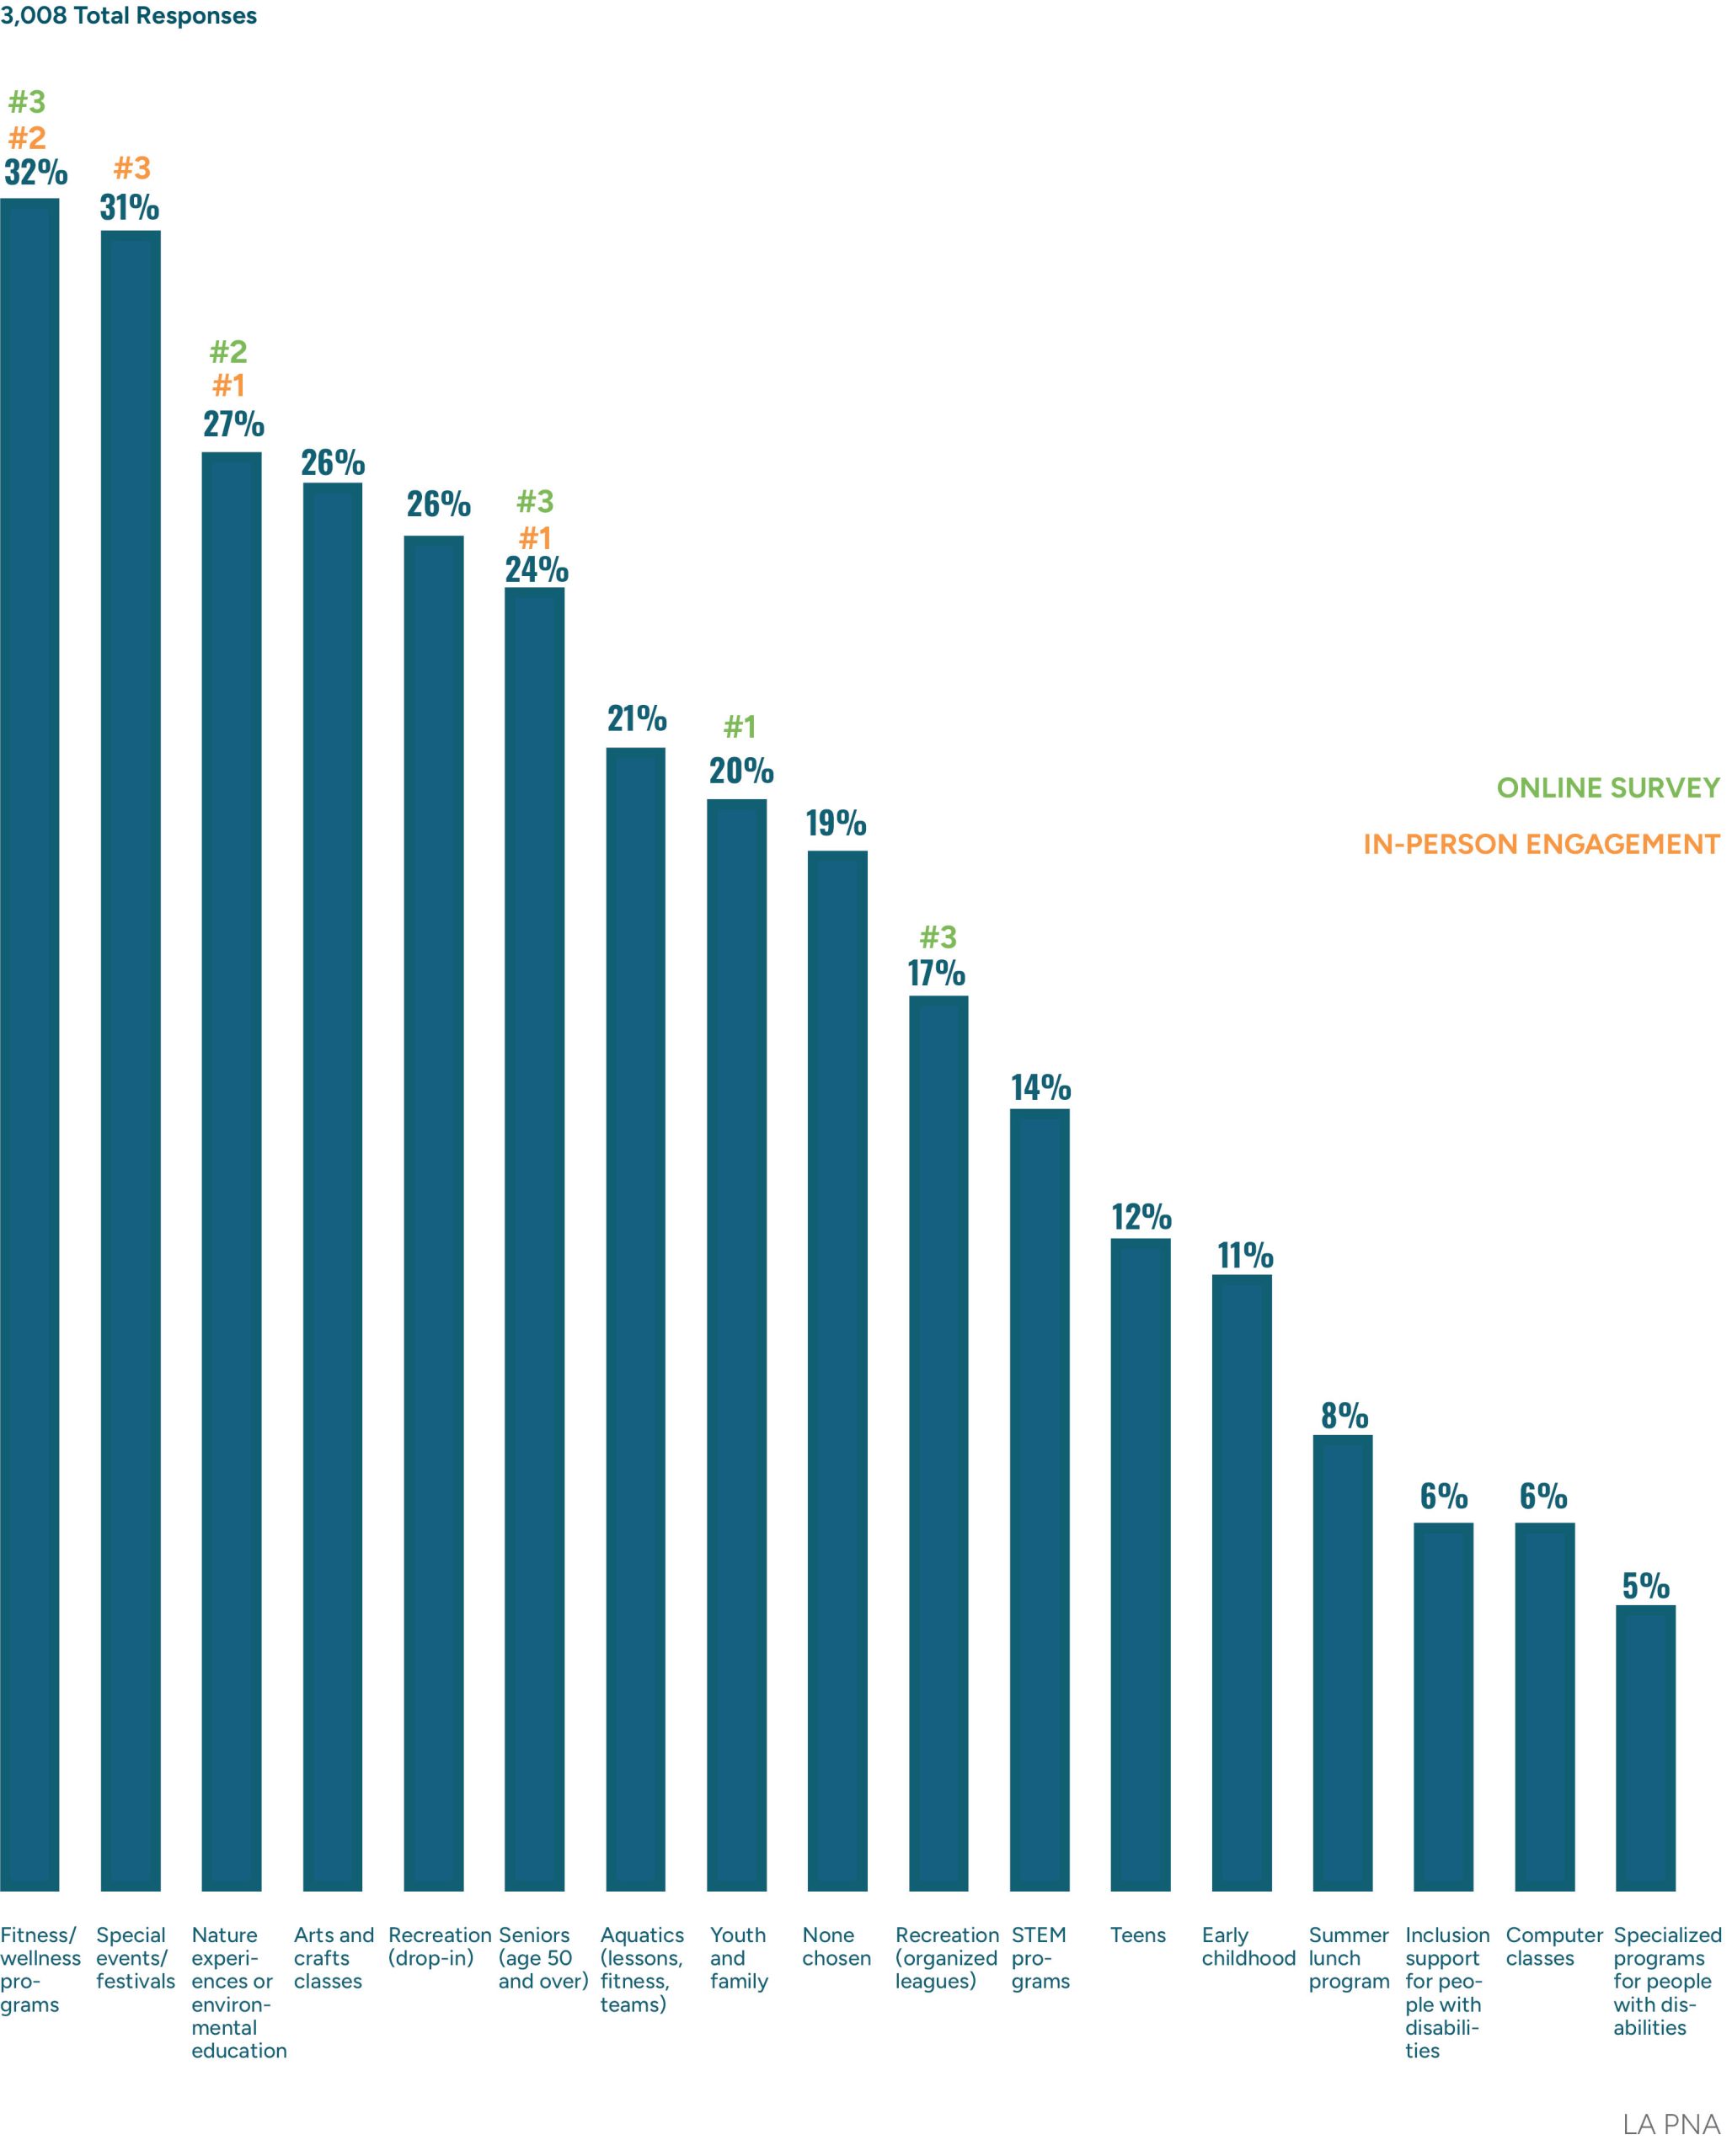
Most Important Programs
Which four of the programs listed below are most important to you and the members of your household?
Fitness, festivals, nature experiences, and arts and crafts classes are the most important programs to respondents.
Top Four Most Important Indoor/Outdoor Facilities and Programs
The Most Important Outdoor Facilities
- Unprogrammed Green Spaces
- Natural Areas and Wildlife Habitats
- Paved, Multi-Use Trails (Walking, Jogging, Biking)
- Non-Paved, Multi-Use Trails (Walking, Jogging, Biking)
The Most Important Indoor Facilities
- Swimming Pool
- Exercise and Fitness Equipment
- Walking / Jogging Track
- Weight Rooms / Gyms
The Most Important Programs
- Fitness / Wellness Program
- Special Events / Festivals
- Nature Experiences or Environmental Education
- Arts and Crafts Classes
The results for outdoor facilities, indoor facilities, and programs were also broken down by region. While there were some differences and variation, there was a lot of overlap and alignment on unprogrammed green space, trails, indoor walking tracks, indoor pools, and events/festivals.
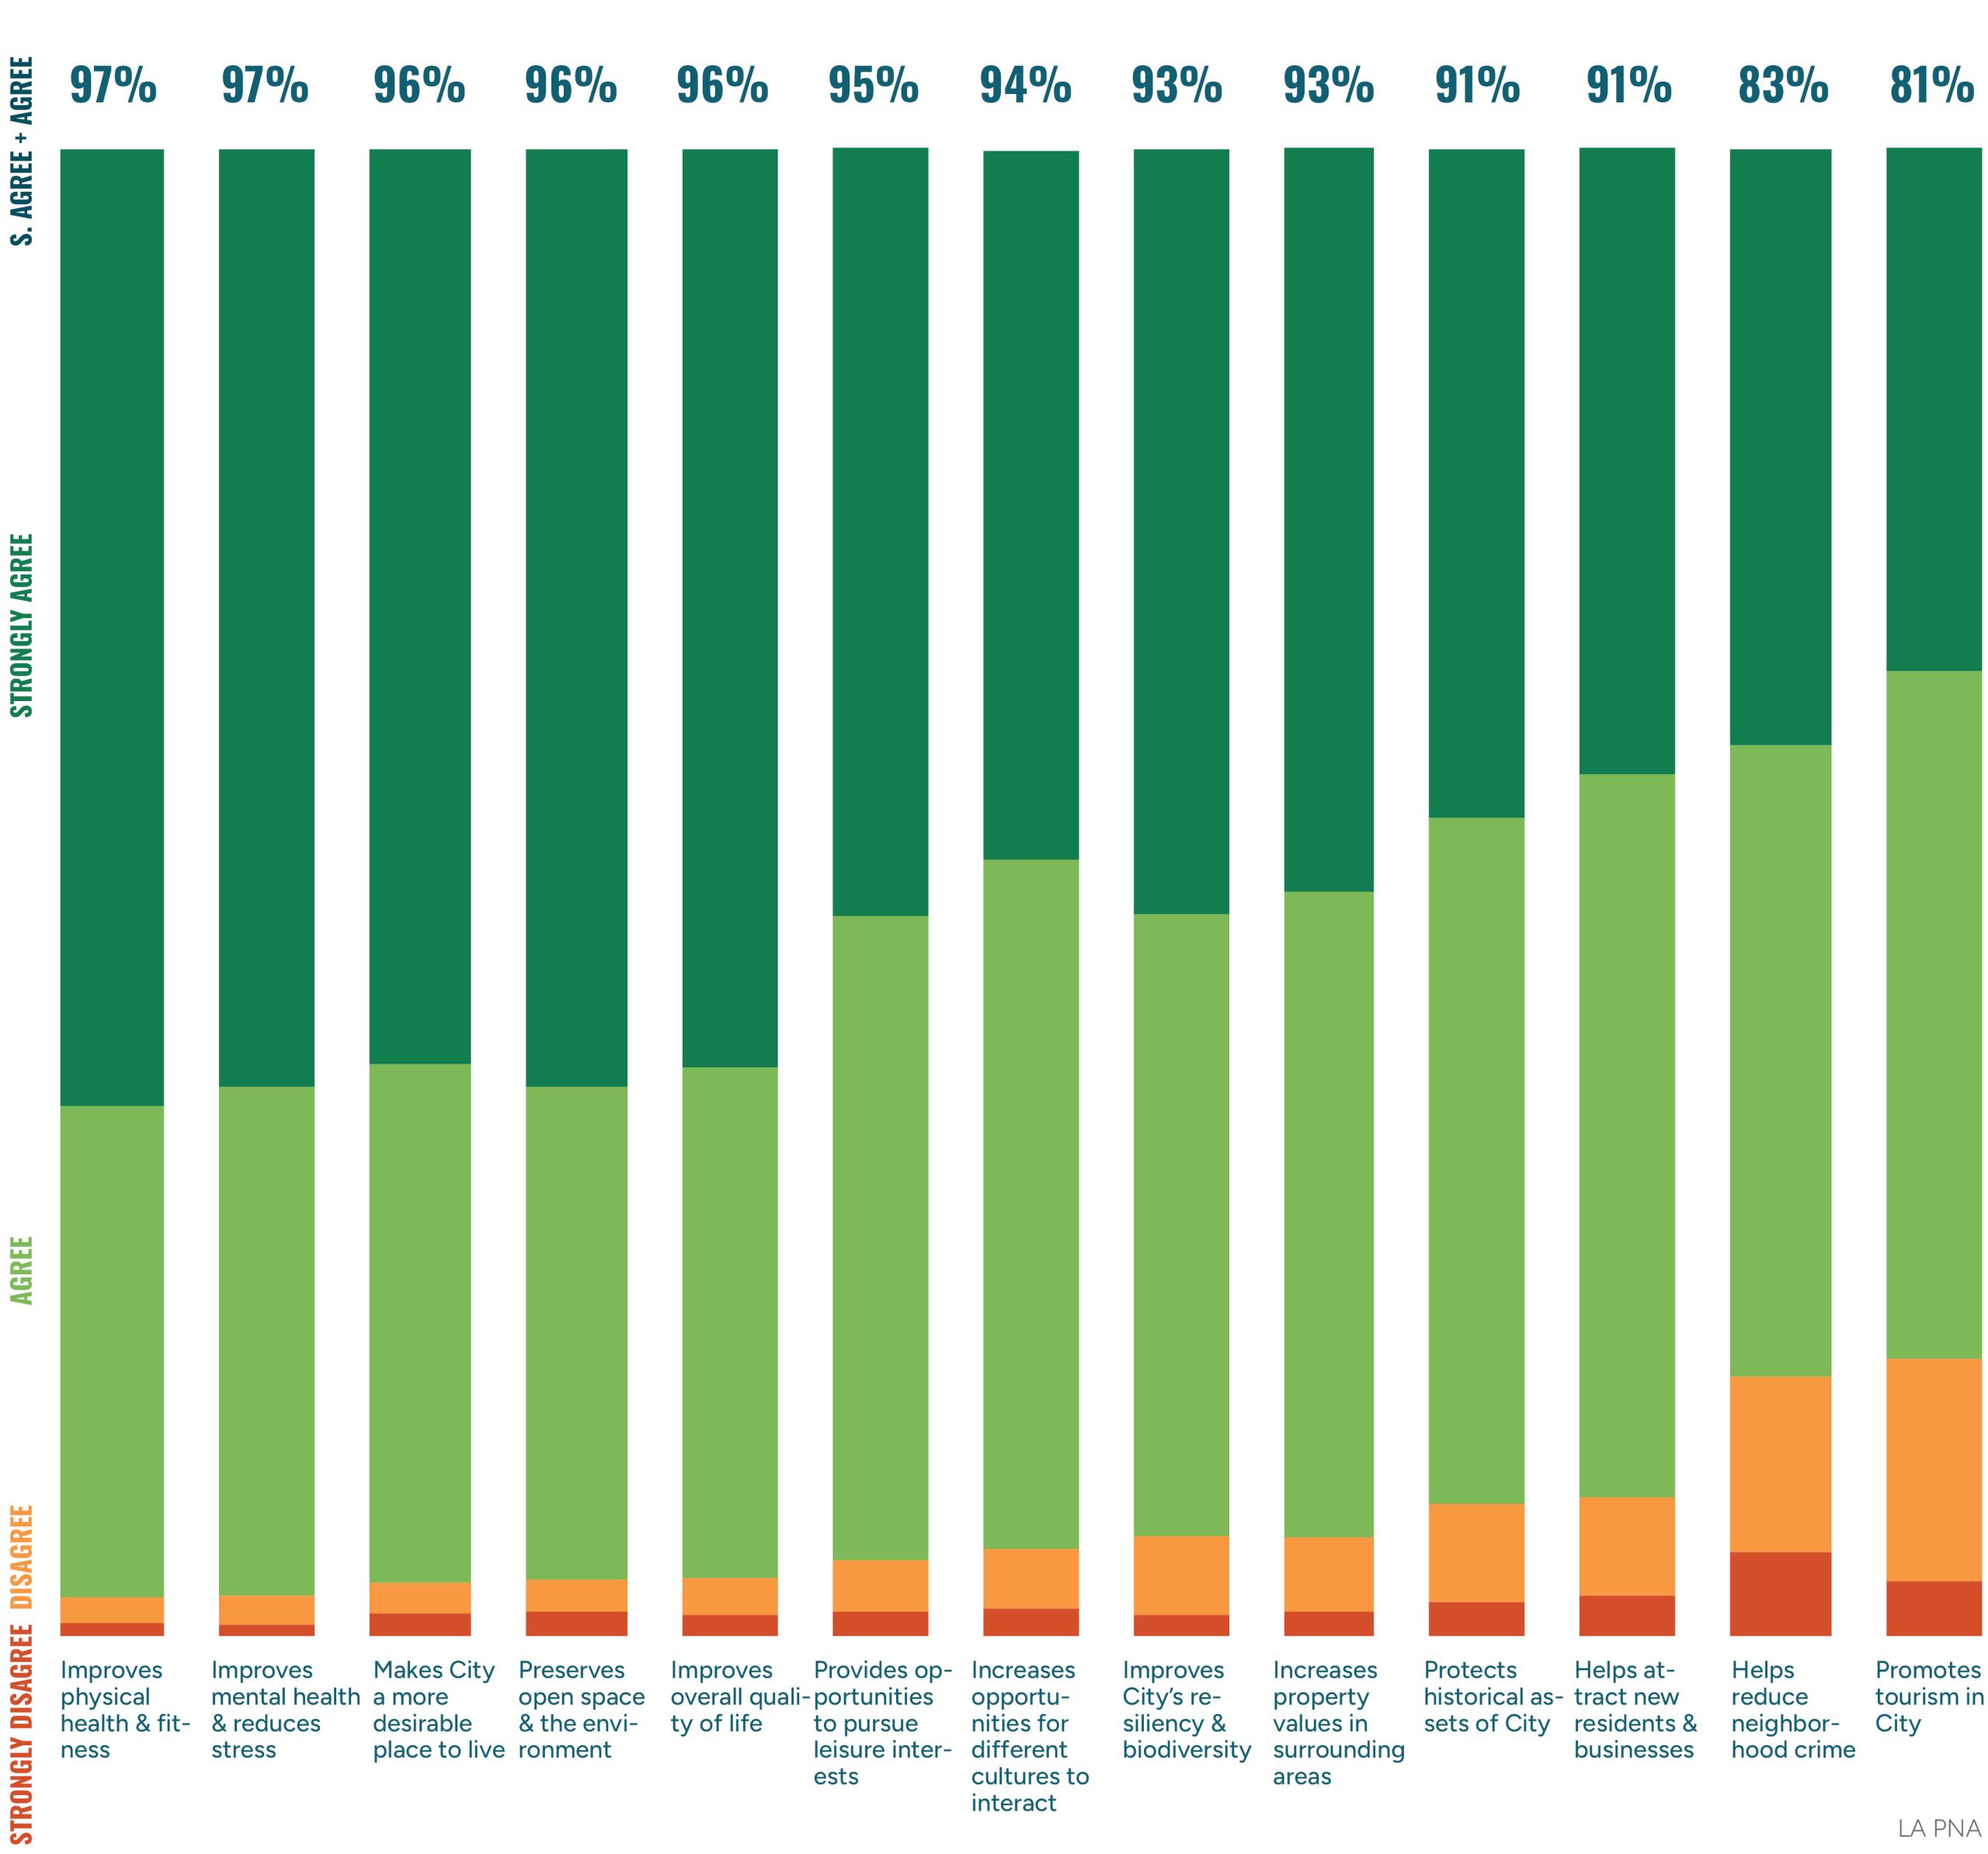
Benefits of Parks
Benefits
Overall, respondents agree that there is a wide range of benefits that parks and recreation facilities provide. There was widespread agreement that parks provide benefits to physical health and fitness, mental health and stress reduction, quality of life, and preservation of open space and the environment.
Most respondents agree that parks, trails, recreation facilities, and programs provide a wide range of benefits.
The following are some benefits parks, trails, recreation facilities, and programs provide. For each benefit, please indicate your level of agreement.
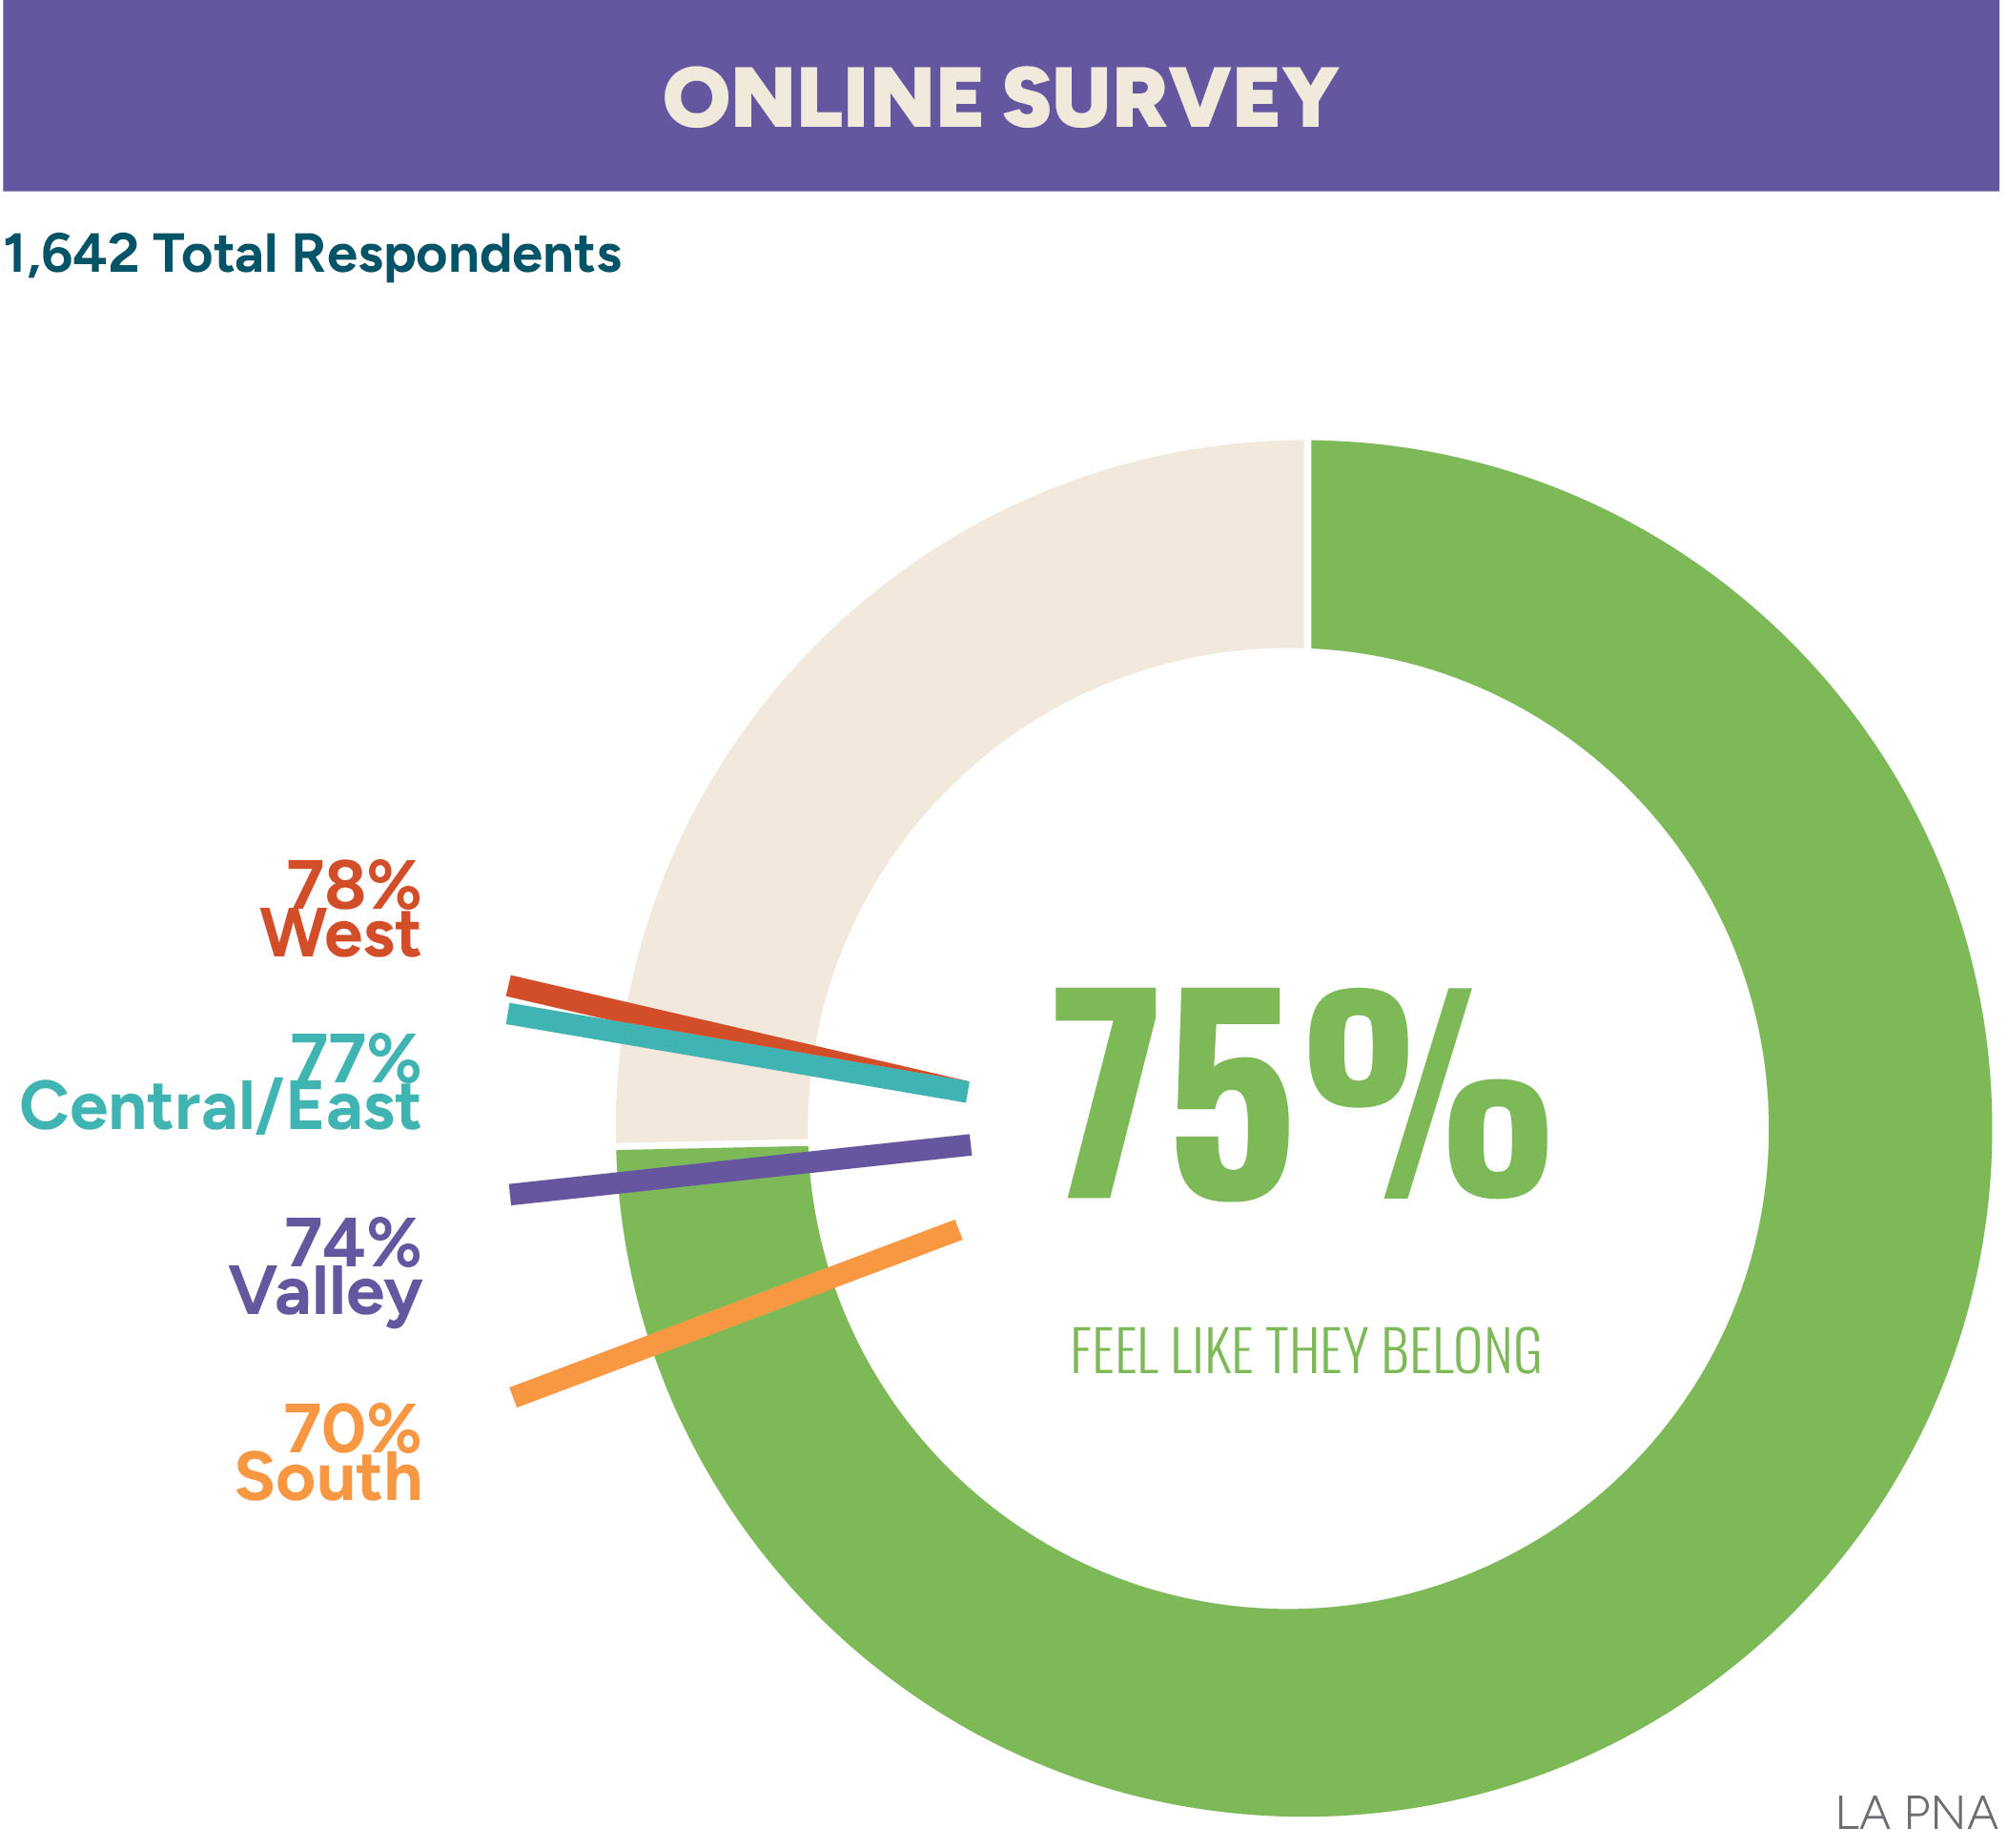
Safety & Belonging
Safety and Belonging
More than three in four online survey respondents feel safe or feel that they belong at least one park or recreation facility.
More than 3/4 of online respondents feel safe and/or feel like they belong in at least one park or recreation facility.
Is there at least one park or recreation facility in Los Angeles where you feel safe?
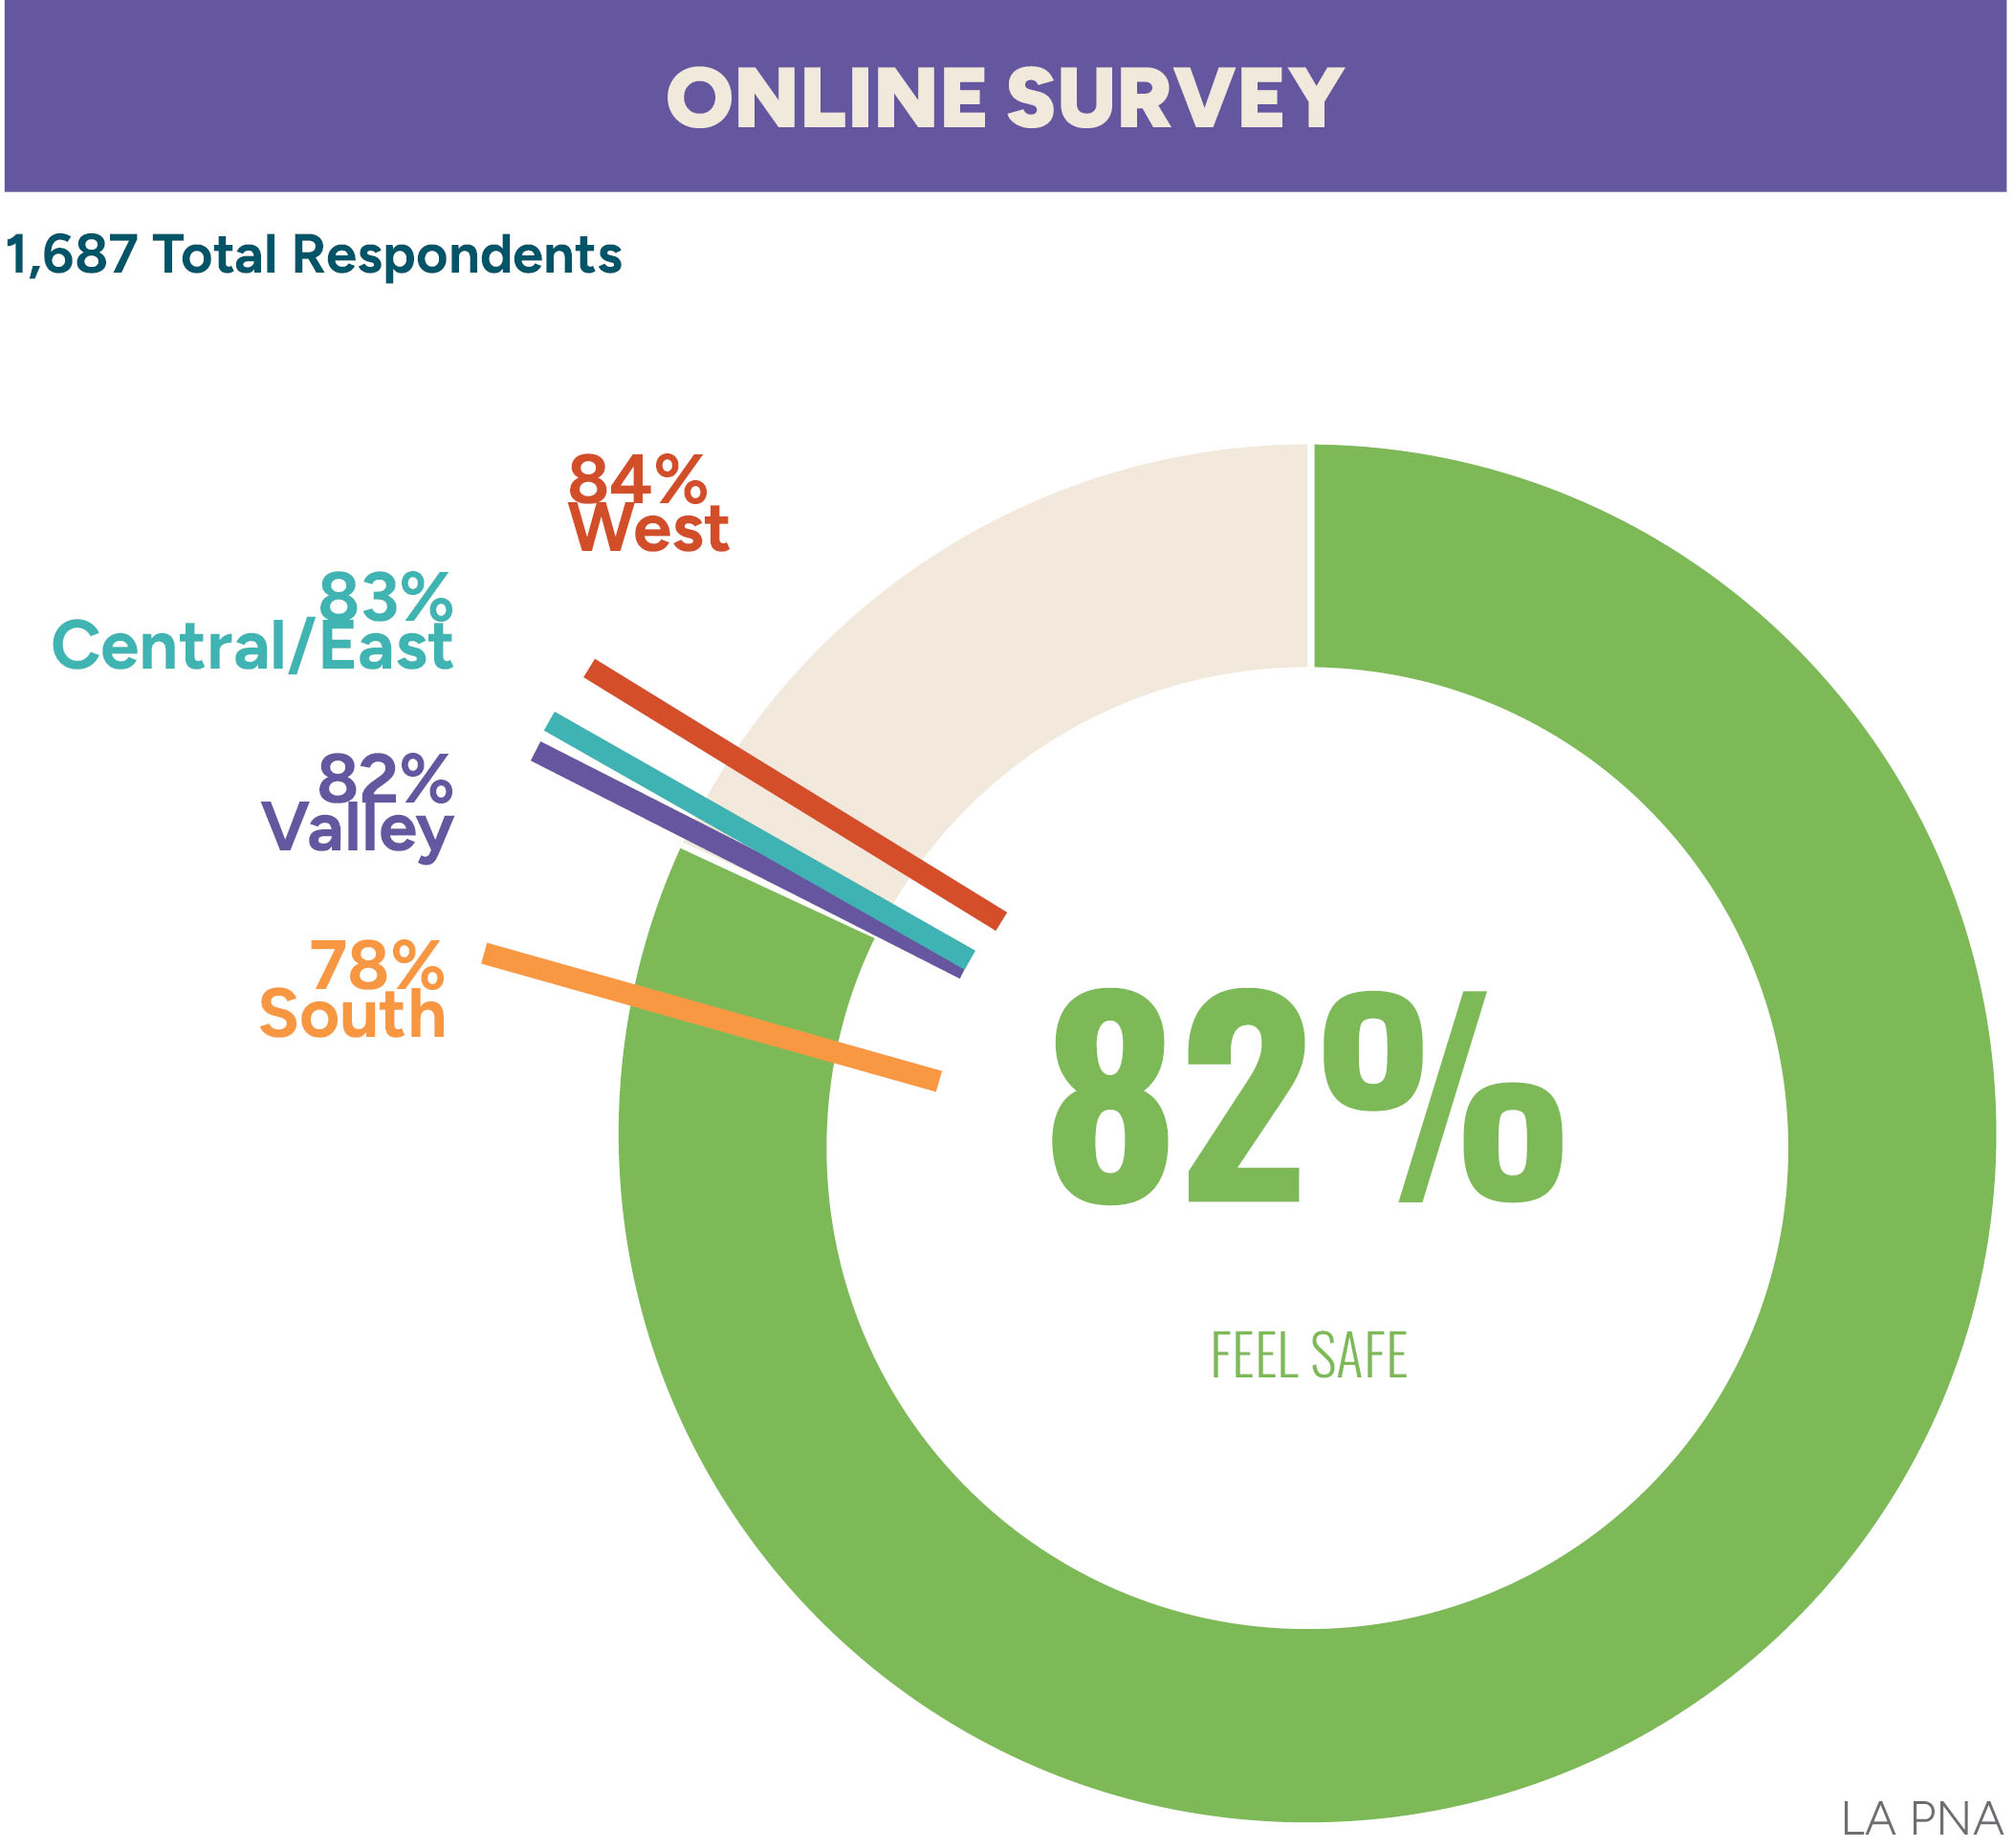
Is there at least one park or recreation facility in Los Angeles where you feel like you belong?
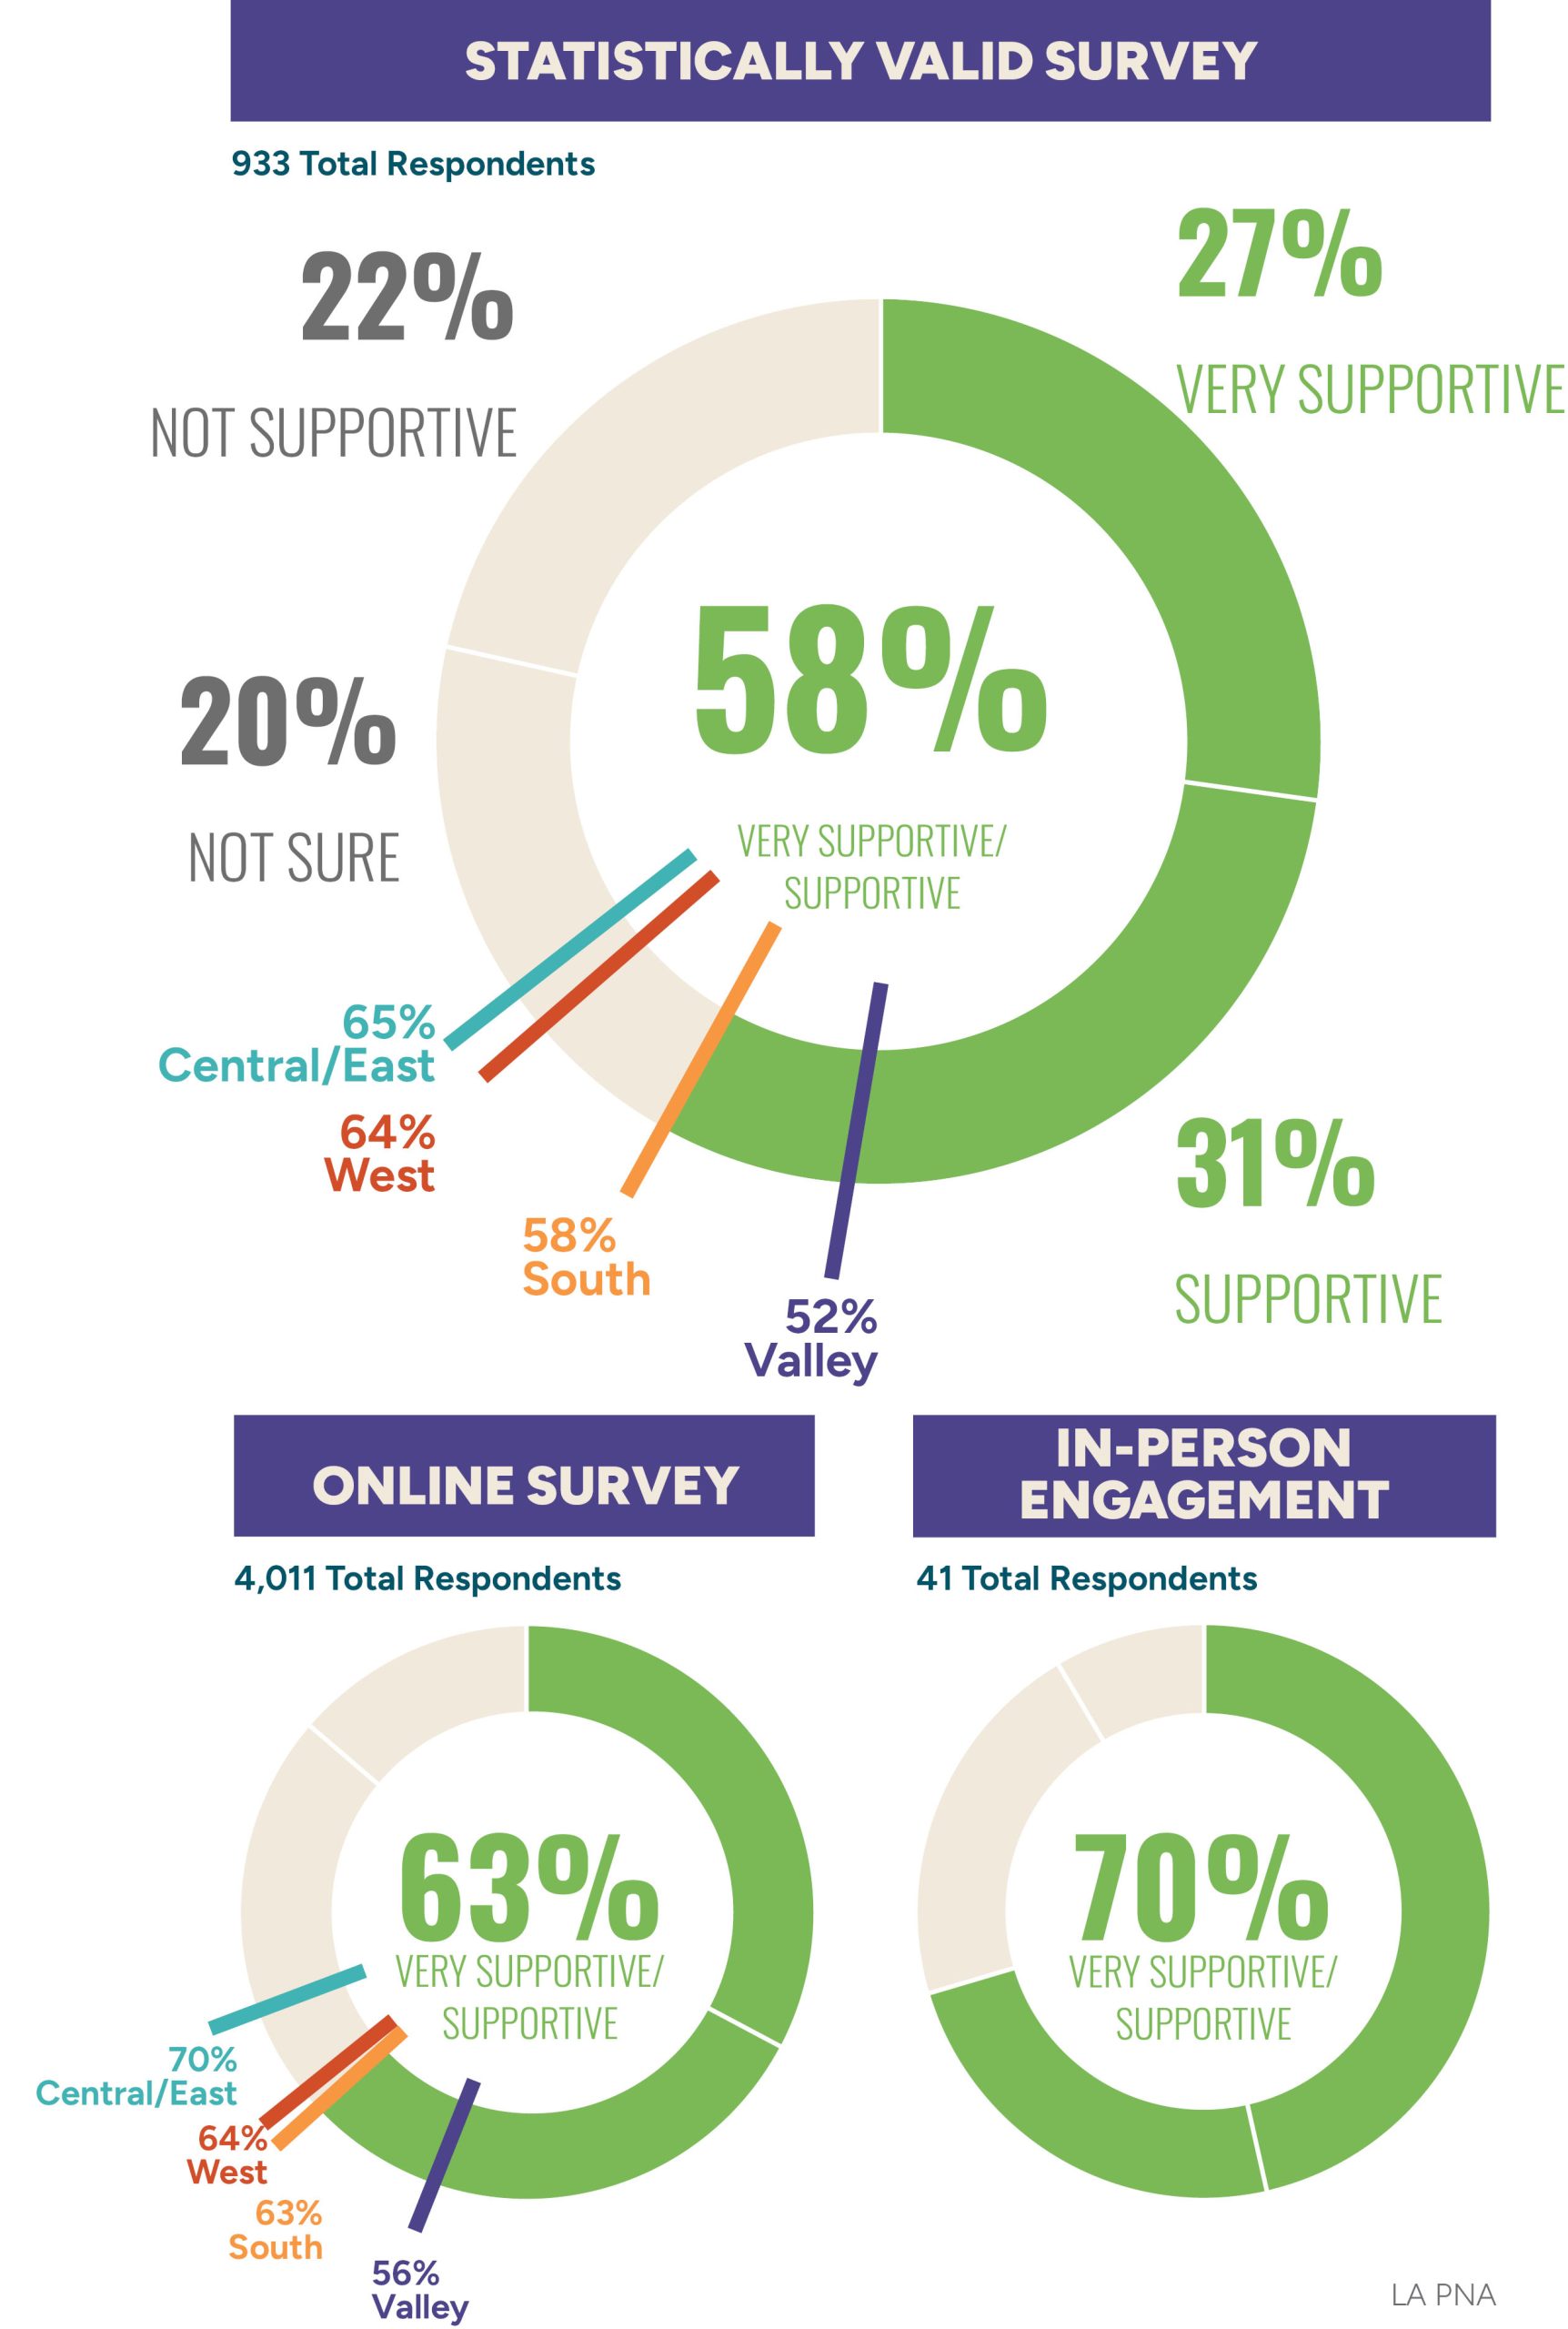
Financial Support
Support for Additional Funding
Most respondents agreed that parks, trails, recreation facilities, and programs provide a wide range of benefits, with agreement ranging from 81% to 97%.
More than half of respondents are supportive of a bond, tax, or levy to fund parks and recreation facilities. In-person meeting attendees were most supportive, at 70%, followed by 63% of online respondents, and 58% of statistically valid survey respondents. While in-person and online respondents had a lower opinion of the conditions of parks and recreation centers, they were also more willing to provide financial support.
Close to 2/3 of respondents are supportive of a bond, tax, or levy to fund parks and recreation facilities.
Which households agree?
Respondents from households with young children aged under 10 (62%) and households who have lived in the City for less than 5 years (70%) are more likely to support funding for parks and recreation facilities.
Which households are less likely to agree?
Respondents from households over the age of 55 and without children (50%), and households who have lived in the City for 6–10 years (50%) and more than 31 years (51%) are less supportive of funding parks and recreation facilities.
What Angelenos Said...
What does Los Angeles need to improve upon with parks and recreation in the future?
“A lot more trees and shade in existing parks. More parks in dense areas. More walking/hiking paths.”
“Putting more park lands in areas in downtown where people live. Few live near the largest park. We need to build places more thoughtfully”
“Downtown LA lacks greenspace. South of Grand Park despite being dotted with empty lots and underused or abandoned commercial properties. Much more could be done here to create small park space.”
“Equity in funding”
“Solve the quality disparity! Why can’t every park have that Griffith Park ‘feel’ no matter the acreage”
“Provide more opportunities for the community to get involved and space for open dialogue”
What does Los Angeles do well in parks and recreation?
“Good trails! Hiking and nice large chunks of areas to explore”
“There is a nice variety and some large tracks of land devoted to parks.”
“Staff are almost always amazing and are there to help kids and have fun!”
“They are everywhere! Pan Pacific is a crown jewel – the grounds have become more beautiful with time and I love and appreciate the summer camp for kids.”
“New parks like the one near Chinatown are well-maintained. Hiking trails are more plentiful than I expected.”
“Diversity, equity and inclusion. My local park is a welcoming place”
What programs would encourage you to use parks and recreation facilities more?
“Senior fitness, community advisory boards for each facility.”
“More shaded playgrounds. Organized recreation programs for younger children (18 months–3 years)”
“Adult sport leagues”
“Programs of networking and community get to know each other event”
“More nature areas with trees and trails instead of just cut grass”
“More intergenerational programming + more trees to encourage private relaxation – meditation garden”
“Urban gardens to address local food access”
How would you make your favorite park more welcoming?
“Provide programming for at risk youth”
“More native plants, bioswales, shade trees”
“Monthly outreaches for homeless with portable showers”
“More outreach to children + families, trained coaches with qualitifcations”
“Shade structures, cool surfaces, converting vacant lots to pocket parks”
“More senior programs”