To prioritize where RAP should invest first, a system of criteria based on community, agency, and stakeholder feedback as well as best practices were used to assess all existing and potential future park sites. These criteria are indicators of need for park investment across the City and cover not just direct park and recreation topics like park pressure and amenity conditions but also social and environmental equity, resilience, and alignment with other City/County initiatives.
Universe of Sites
The context and challenges of the parks and facilities in the RAP system vary greatly across the City. For RAP to prioritize future investments first requires having an up-to-date inventory of all the sites that RAP could potentially invest in–referred to here as the “universe of sites.” The universe of sites includes RAP’s existing parks as well as prospective sites where RAP might invest in developing new parks so that both can be prioritized side-by-side.
Existing RAP Park Sites
RAP manages over 500 parks within city boundaries. For the purposes of site prioritization for future investment, camps outside of city boundaries (e.g., Camp Valcrest and Camp High Sierra) were excluded, and subparks (e.g., the Los Angeles Zoo and Botanic Gardens within Griffith Park) were not considered independently. With those exceptions and exclusions, 483 existing park sites were evaluated as a part of the Universe of Sites.
Prospective Park Sites
The PerSquareMile tool developed by GreenInfo Network and the UCLA Institute of the Environment and Sustainability was used to identify potential locations where RAP might invest in developing new parks.
The tool was created to understand access to parks and the outdoors at a granular level across California. It is designed to identify areas with the greatest number of people in need of nearby parks. By overlaying a one-square-mile grid that covers the City of Los Angeles with high-resolution population location data, the tool can pinpoint where residents lack access to parks within a half-mile of their homes.
For the PNA, the PerSquareMile tool was used to assess two metrics:
Park access – the number of people without a park within a 10-minute walk of their homes
Park supply – the number of park acres per thousand people
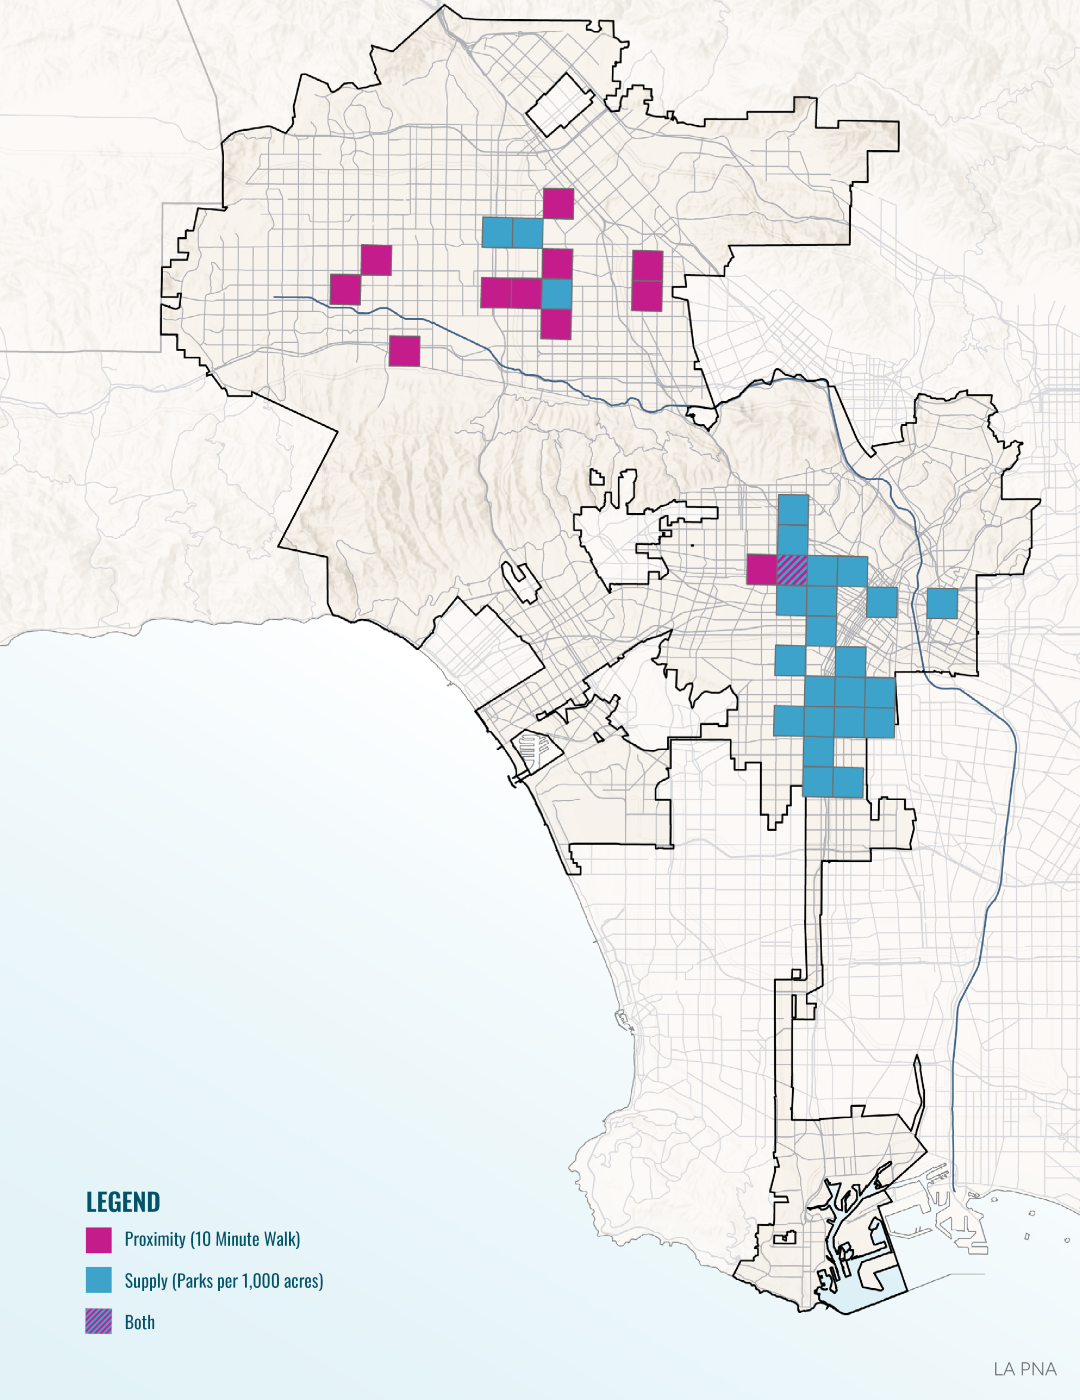
The square-mile grid cells chosen as prospective park sites contain top 25% of residents lacking in either the park access or park supply metrics and are also either in the top quartile of exposure based on their CalEnviroScreen4.0 (CES) or identified as a Disadvantaged Community (DAC). Through this process, 36 prospective park sites were added to the universe of sites alongside the 483 existing parks.
THIS MAP IDENTIFIES POTENTIAL PRIORITY SITES FOR ADDRESSING THE TOP 25% OF THE NEED FOR NEW PARKS (PROXIMITY) AND ADDITIONAL PARK ACREAGE (SUPPLY), AS PART OF THE POTENTIAL UNIVERSE OF SITES FOR THE PNA.
THIS ANALYSIS ALSO TAKES INTO ACCOUNT THOSE WHO LIVE IN DISADVANTAGED COMMUNITY AREAS (DAC) AS WELL AS THOSE WHO LIVE IN HIGH EXPOSURE AREAS BASED ON CALENVIROSCREEN (CES75+).
Within the Grid Cells
Each PerSquare Mile grid cell has opportunities within it for additional parkland. These opportunities include entirely new parks, partnership or joint-use agreements with other entities, or adaptation of single-use infrastructure into multi-benefit sites. Within the 36 grid cells there are over 170 K-12 school campuses and 509 other public parcels that could be potential sites for future parks and recreation spaces. Five of the 36 grid cells contain public parcels already zoned as “open space.”
The “Universe of Sites” includes existing RAP facilities as well as areas identified for prospective park sites in the future.