To address the challenge of visualizing around 500 parks and park facilities across the City, a ‘park pixel’ method was developed for the PNA to depict each park in a simplified format.
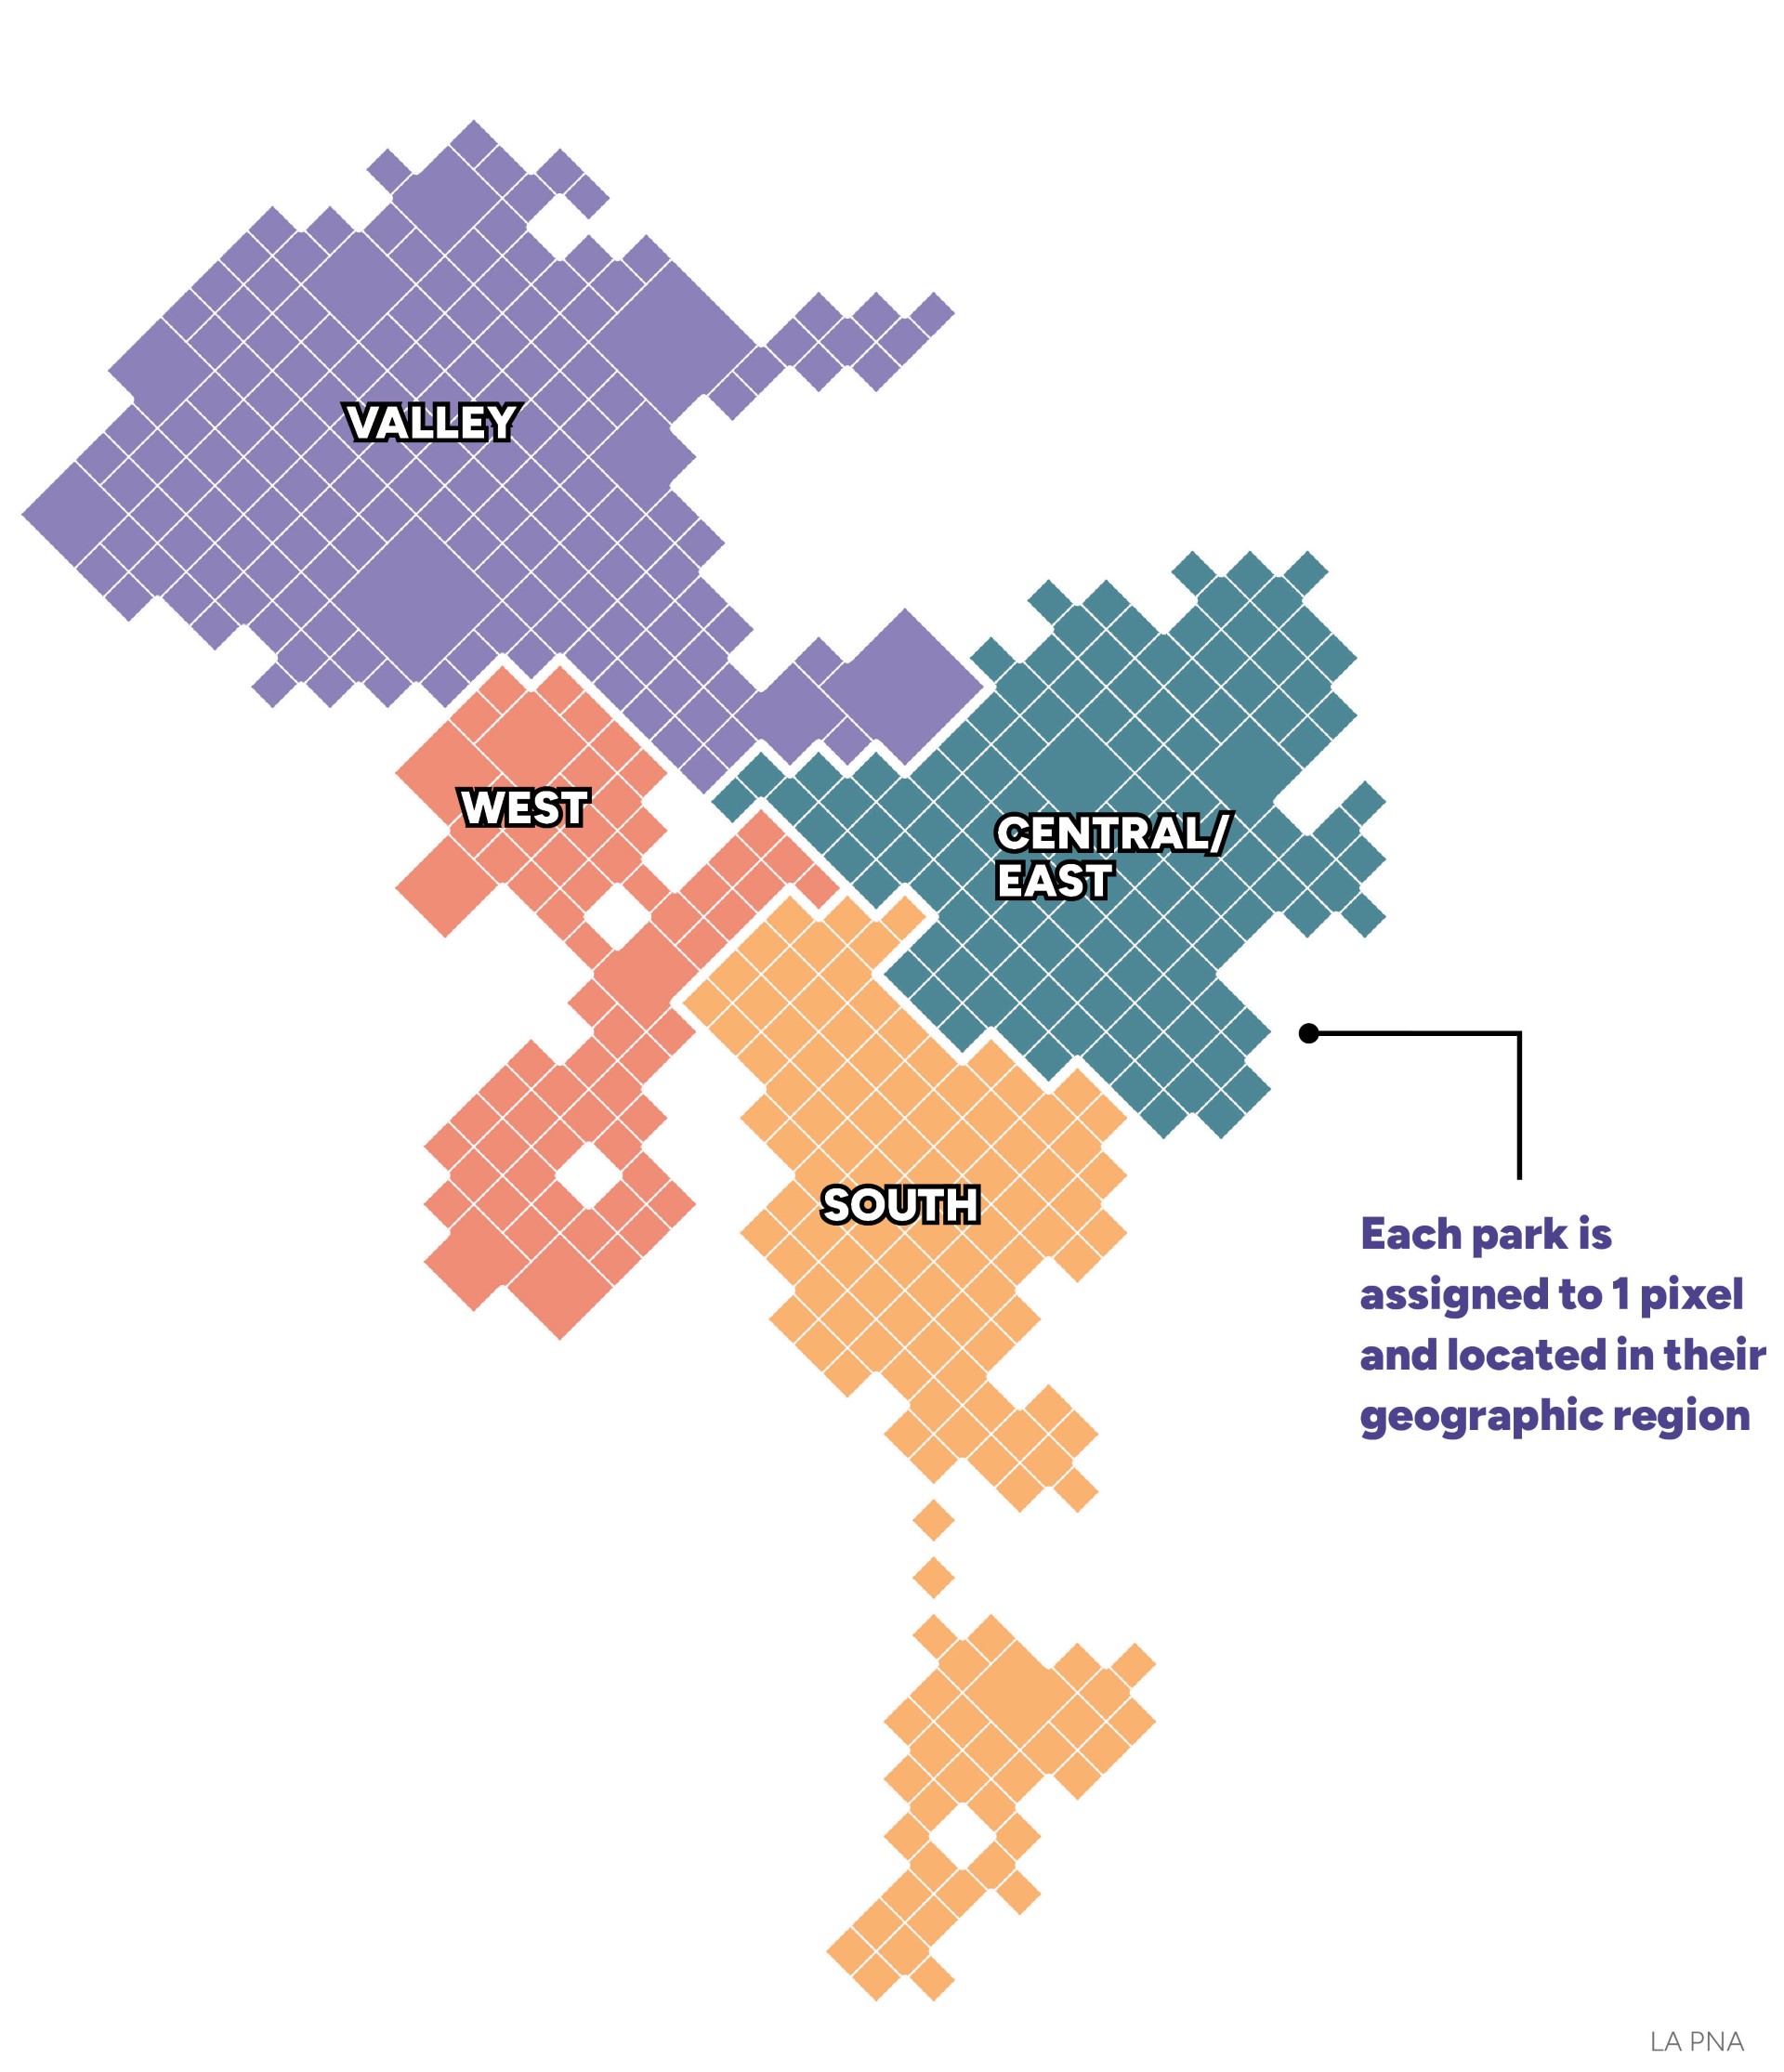
In this approach, each park is represented as a pixel in its current location.
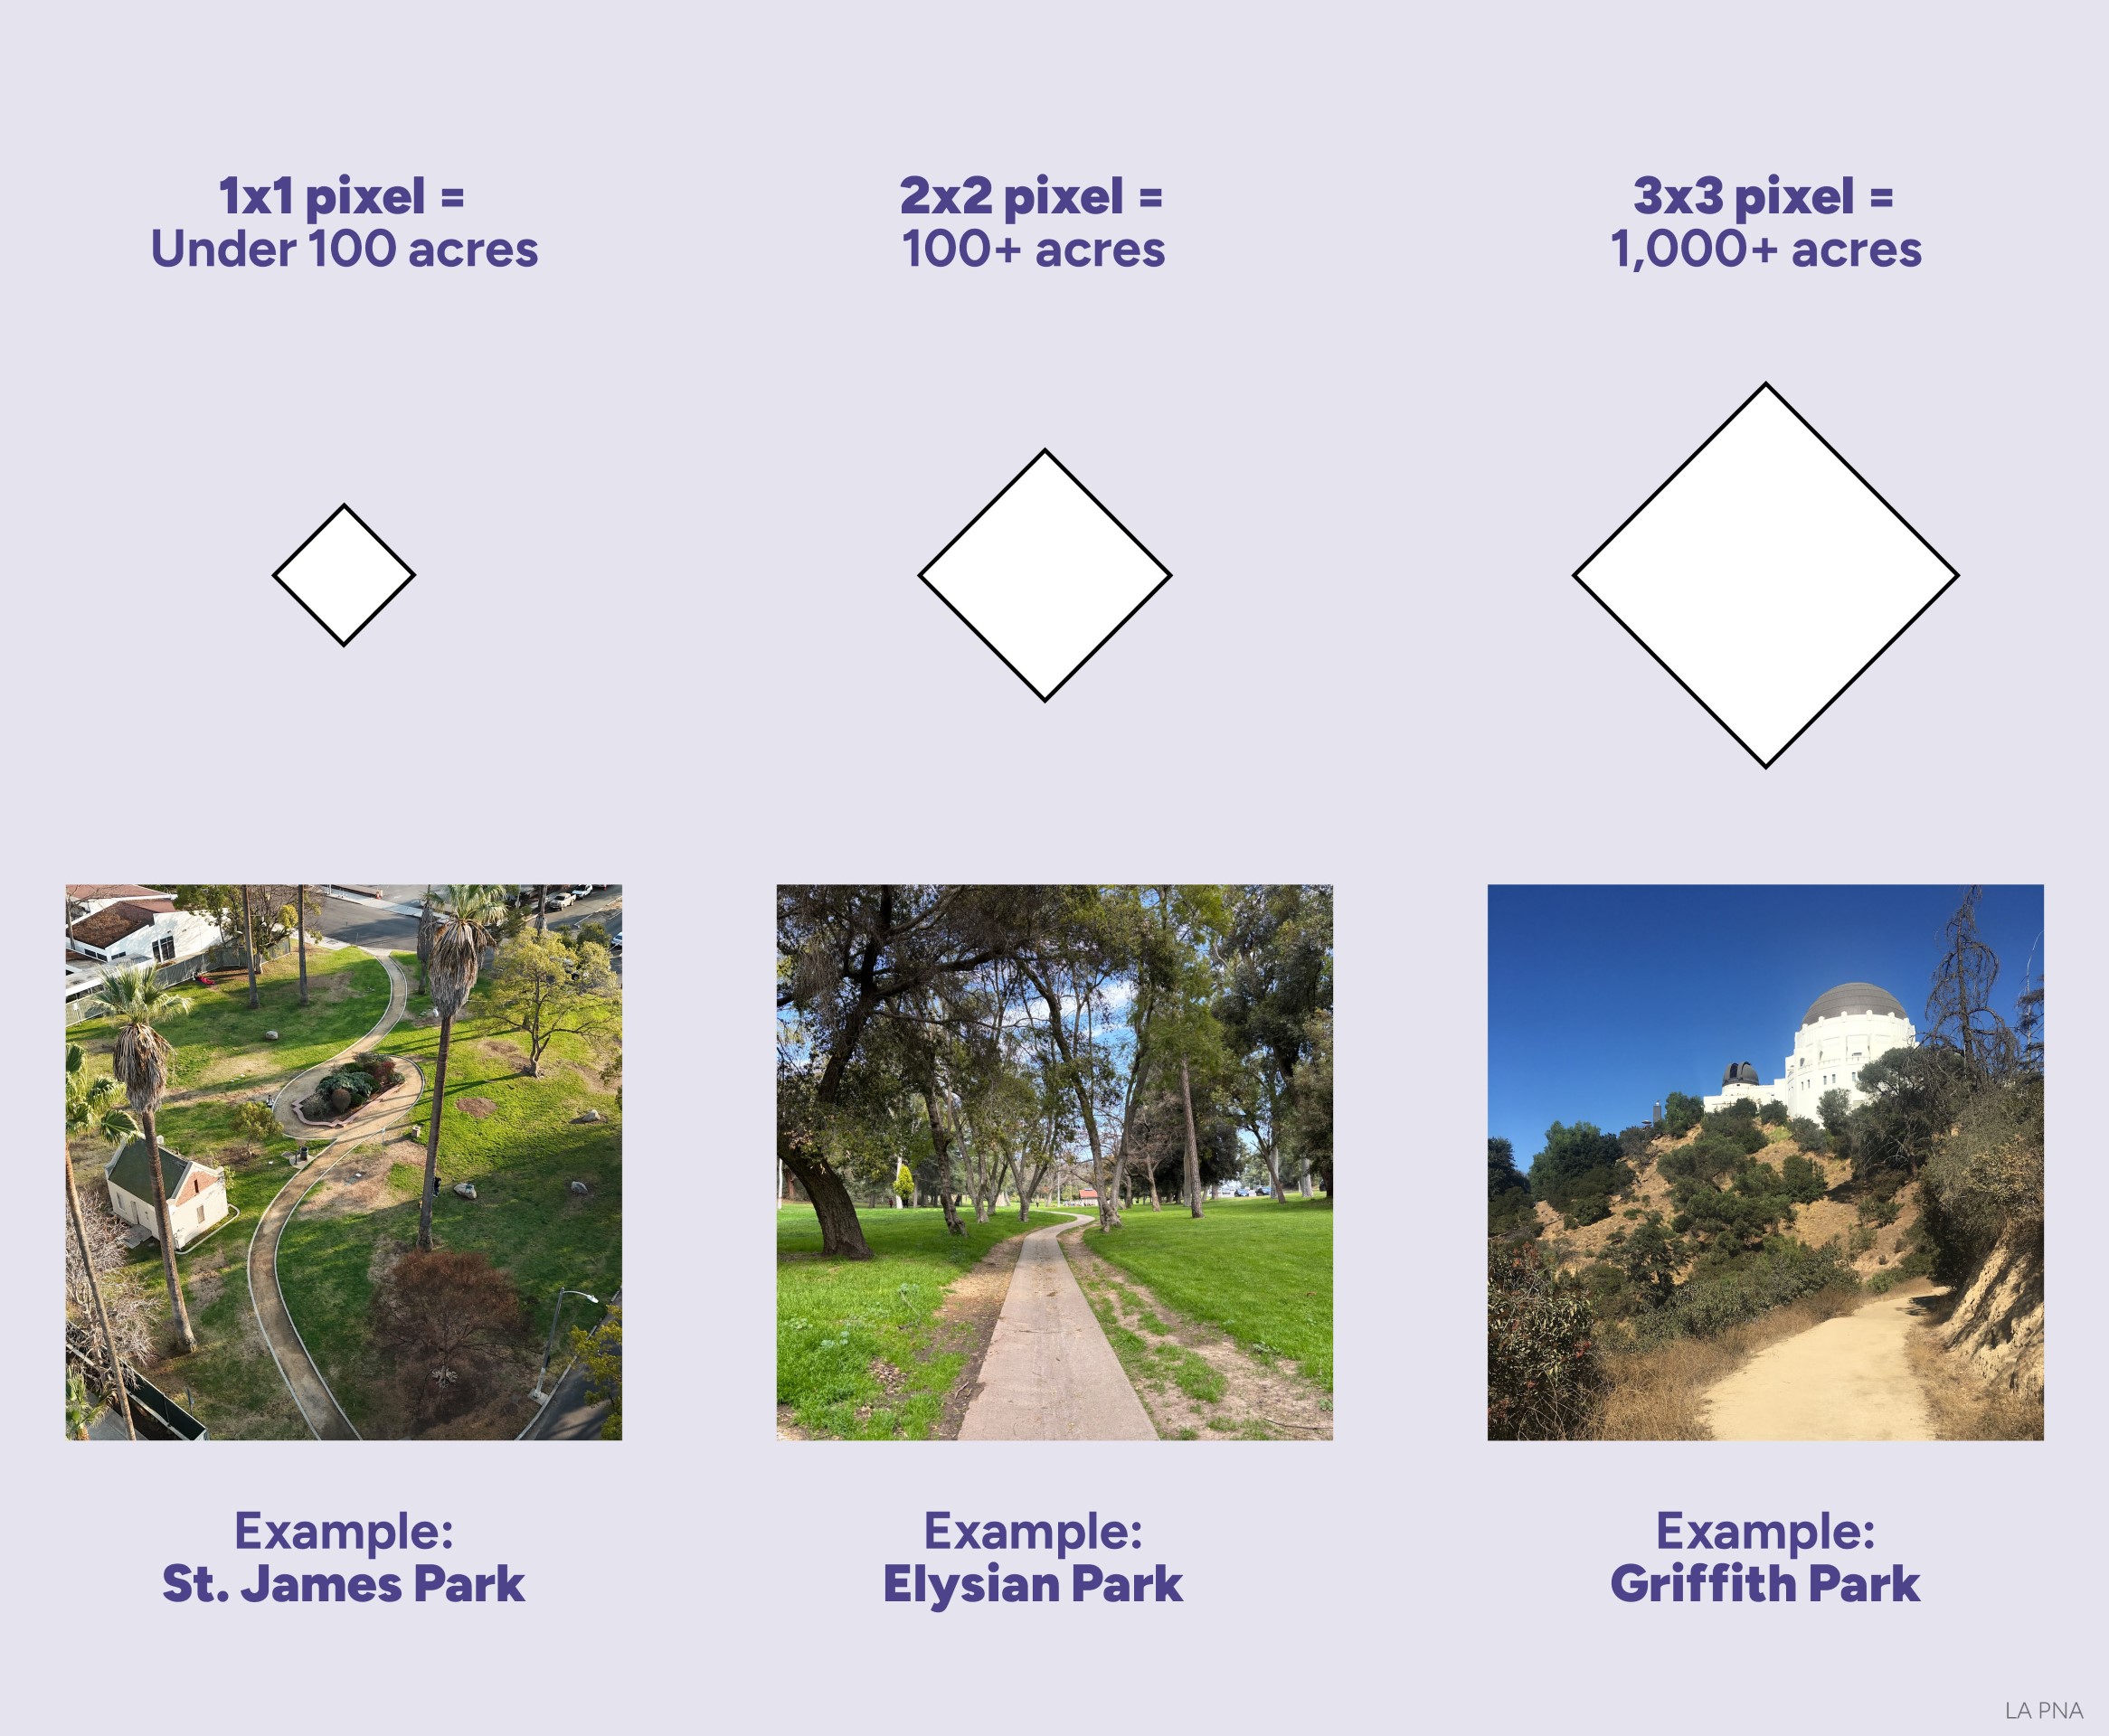
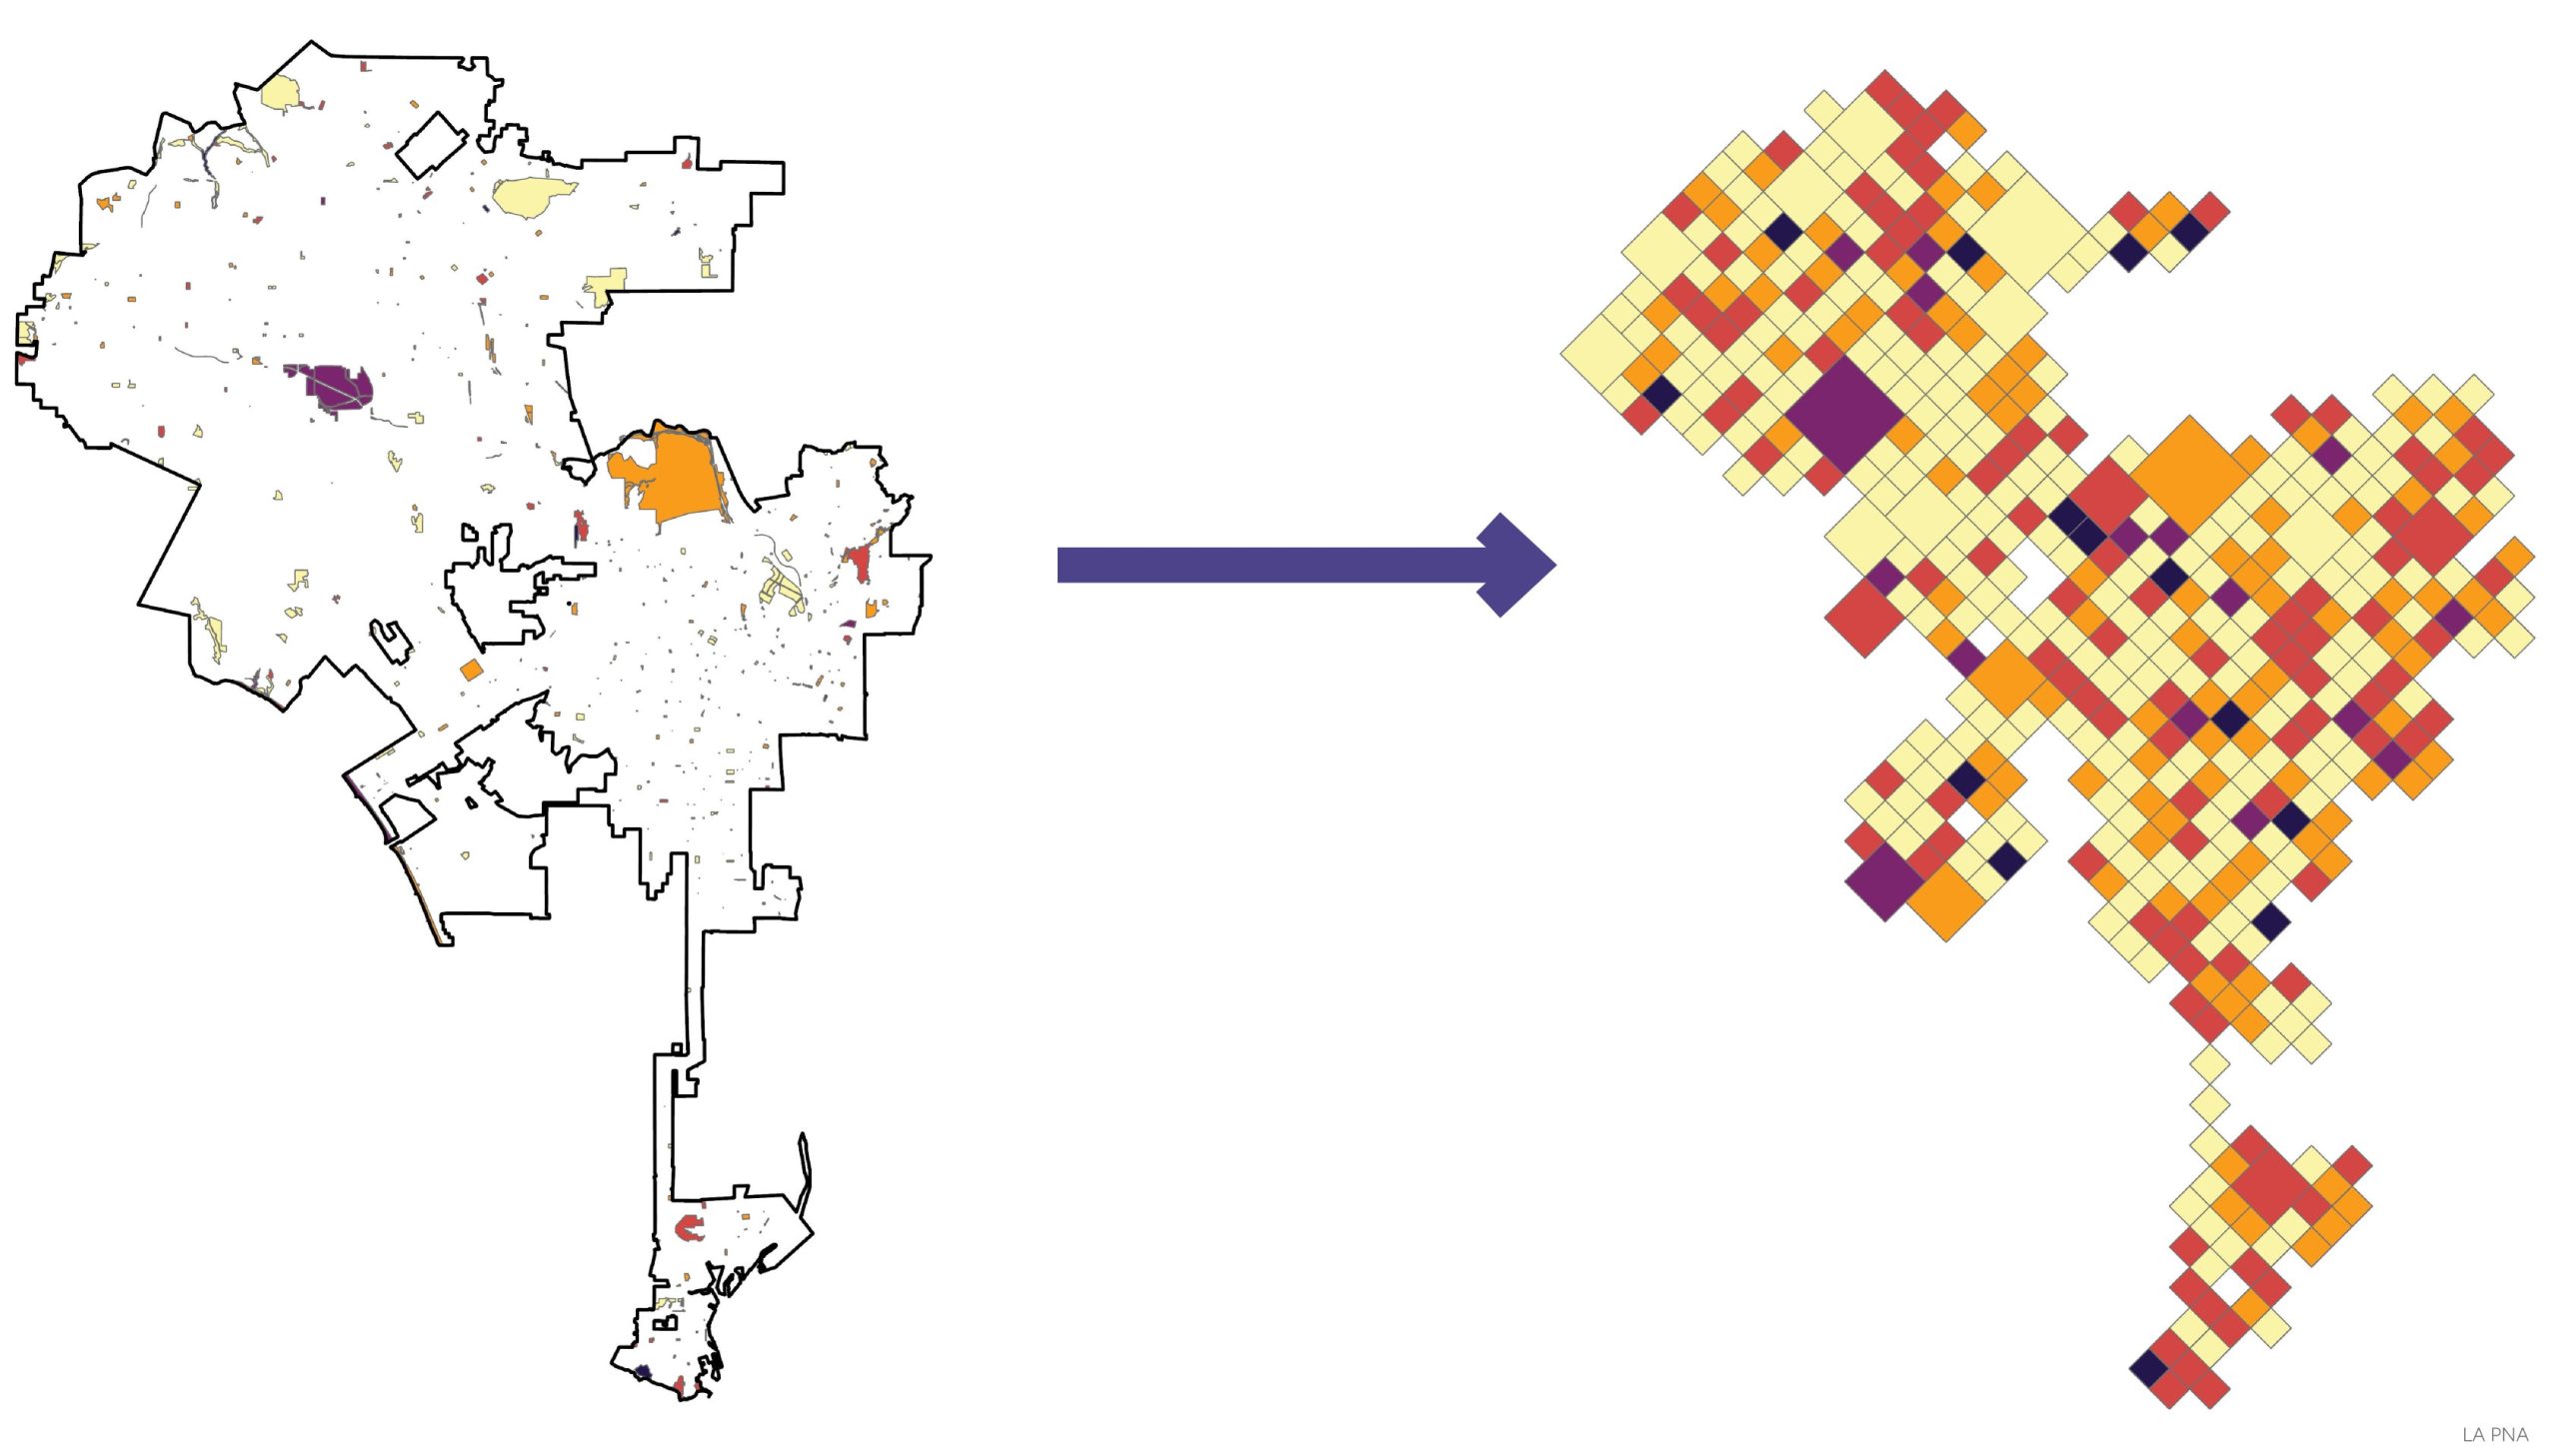
The pixel size corresponds to park acreage: parks under 100 acres are shown as 1×1 pixels, parks between 100 and 999 acres as 2×2 pixels, and parks over 1,000 acres as 3×3 pixels. This abstraction helps make complex data more accessible and enables a clearer visualization of the full park system at a citywide scale, particularly when mapping site prioritization (see below as an example). The pixel map also allows viewers and users of the PNA to understand how parks compare in terms of size and relative need, allowing patterns and gaps to emerge more legibly.
Saint James Park is a park under 100 acres and represented by a 1×1 pixel. Elysian Park is between 100 and 1,000 acres and is represented by a 2×2 pixel. Griffith Park is over 1,000 acres and is represented by a 3×3 pixel.
Viraj Chauhan/Agency Artifact, 2025. Nora Healy/Kounkuey Design Initiative, 2025. Mary Alice William/The Robert Group, 2025.


